Greater Chicago & the Midwest
FP&A for Technology & Subscription Businesses
Connect recurring revenue, customer retention, growth investment, and cash to better financial decisions.
Northline FP&A helps privately held and PE-backed technology and subscription businesses throughout Greater Chicago and the Midwest improve recurring-revenue forecasting, profitability visibility, KPI reporting, cash planning, and strategic decision support.
Built for businesses where growth depends on recurring revenue, customer retention, sales productivity, and disciplined investment.
- ARR & MRR forecasting
- Retention & cohort analytics
- Unit economics
- Cash runway & capacity planning
Designed for growing businesses generally between $10M and $100M in annual revenue.
The challenge
Growth Can Look Strong While the Economics Tell a Different Story
Technology and subscription businesses run on financial drivers that a traditional P&L never shows. Revenue is the outcome; customer behavior, sales productivity, and delivery cost are the causes.
Common drivers
- ARR / MRR
- Bookings
- Backlog
- Contract value
- Churn
- Retention
- Expansion revenue
- Pricing
- Customer acquisition
- Gross margin
- Implementation costs
- Support costs
- Sales capacity
- Headcount
- Cash burn
Top-line growth is only one part of the story. The quality, durability, and profitability of that growth matter just as much.
Two companies can post the same growth rate while one is compounding a retained customer base and the other is replacing churn with expensive new bookings. FP&A makes that difference visible before it shows up in cash.
Five technology FP&A questions
Can Your Finance Function Answer These Questions Quickly?
What will ARR or recurring revenue look like 6–12 months from now?
How much growth is coming from new customers versus expansion and retention?
Which customers, products, or service tiers generate the strongest lifetime economics?
How much sales and operating investment can the business support?
What happens to cash if growth slows, churn increases, or hiring accelerates?
Technology FP&A should connect customer behavior, operating investment, and recurring revenue to financial outcomes.
Warning signs
Signs Your Technology FP&A Capability Needs Improvement
- ARR or MRR is reported but not forecasted reliably.
- Sales pipeline is disconnected from the financial forecast.
- Churn and retention metrics are inconsistently defined.
- Customer acquisition spending is not tied to customer economics.
- Sales hiring decisions are not connected to productivity assumptions.
- Gross margin changes are difficult to explain.
- Implementation or support costs are not visible by customer or segment.
- Cash runway is unclear.
- Management focuses on bookings or ARR without understanding conversion to revenue and cash.
- Forecasts depend heavily on manual spreadsheets.
- New pricing or packaging decisions are not modeled financially.
- Board or investor reporting requires significant manual effort.
- Finance does not measure forecast accuracy.
If several of these conditions exist, the company may have a recurring-revenue visibility gap rather than an accounting problem.
Core capabilities
Financial Planning Built Around Recurring Revenue Economics
Revenue & ARR Planning
- ARR / MRR forecasting
- Bookings
- Backlog
- New logo growth
- Expansion revenue
- Renewals
- Pricing
- Contract timing
Retention & Churn Analytics
- Gross retention
- Net retention
- Customer churn
- Revenue churn
- Cohort analysis
- Expansion / contraction
Unit Economics
- Customer acquisition cost
- Lifetime value
- Payback
- Contribution margin
- Cost-to-serve
- Customer profitability
Sales & Capacity Planning
- Quota
- Ramp time
- Productivity
- Pipeline
- Conversion
- Sales hiring
- Capacity
Cash & Investment Planning
- Cash runway
- Hiring plans
- Growth investment
- Operating leverage
- Financing needs
- Scenario planning
Strategic Decision Support
- Pricing
- Packaging
- Customer segmentation
- Product investment
- Sales expansion
- Acquisitions
- Growth scenarios
ARR & MRR forecasting
Build a Forward View of Recurring Revenue
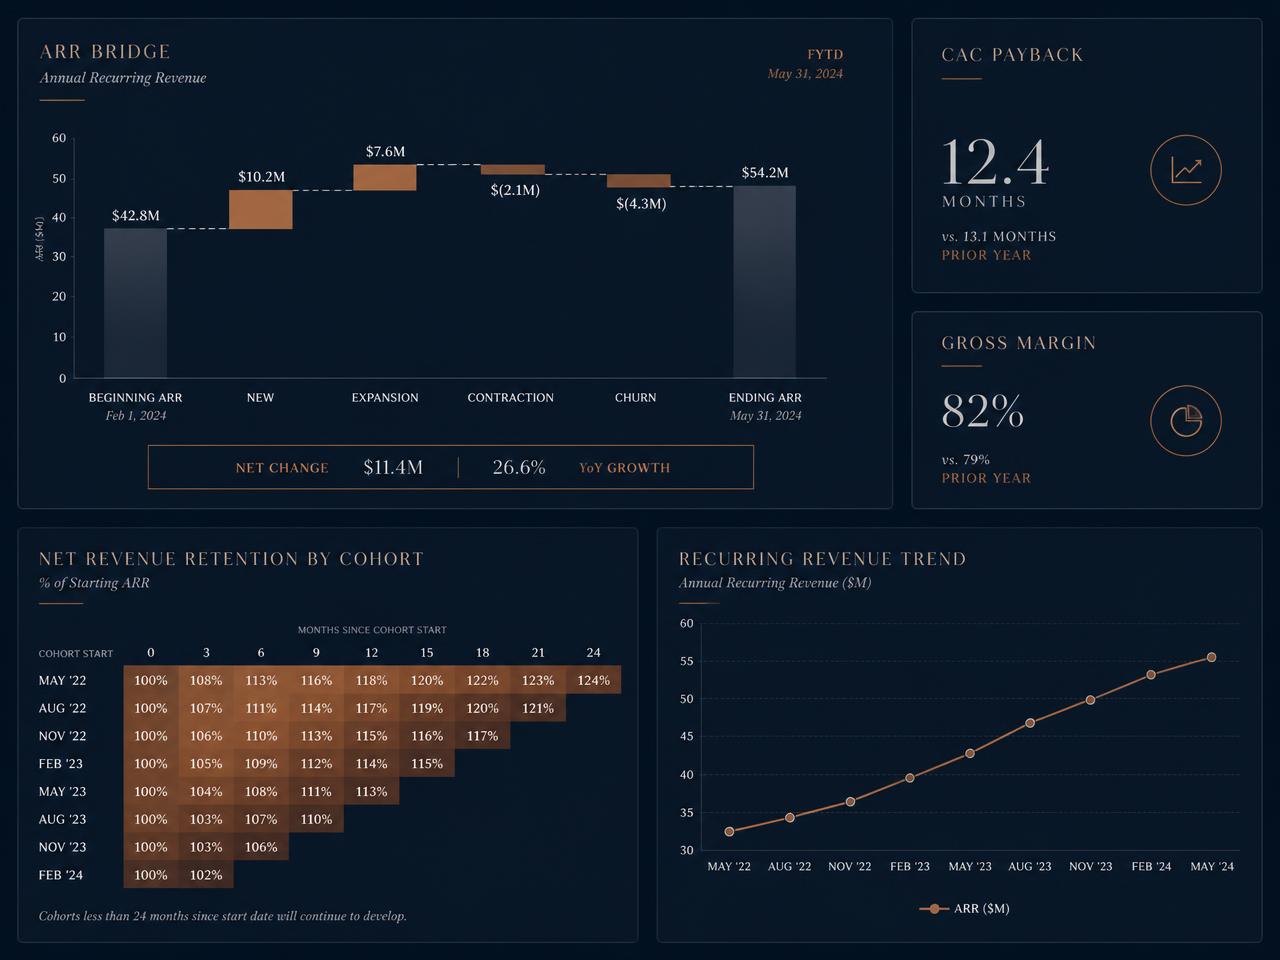
A recurring-revenue forecast should separate the movements that create and destroy ARR rather than applying a single growth rate.
ARR bridge
- Beginning ARR
- + New business
- + Expansion
- – Contraction
- – Churn
- = Ending ARR
Management should understand
- How much recurring revenue is contracted
- Expected renewals
- Churn risk
- Expansion opportunities
- New sales contribution
- Pricing impact
A useful ARR forecast explains not only how recurring revenue changes—but why.
Because ARR and MRR definitions differ by business model, the first step is agreeing on a definition that ties back to contracts and reported revenue. See our financial forecasting approach.
Retention & churn
Understand the Durability of Revenue
Recurring-revenue businesses should measure retention consistently, in a way management and the board can interpret the same way each month.
What we measure
- Customer retention
- Gross revenue retention
- Net revenue retention
- Churn
- Contraction
- Expansion
Gross retention
How much recurring revenue remains before expansion.
Net retention
How recurring revenue changes after both losses and expansion.
Retention metrics help management distinguish sustainable growth from growth that depends on constantly replacing lost customers.
Cohort analysis
See How Customer Economics Develop Over Time
Grouping customers by when and how they were acquired shows how relationships actually mature—retention, expansion, and delivery cost all change with age.
Possible cohorts
- Acquisition month
- Acquisition quarter
- Customer segment
- Product
- Channel
- Contract size
Potential measures
- Retention
- Expansion
- Churn
- Gross margin
- Support cost
- Lifetime economics
Cohort analysis helps management understand whether newer customers are performing better—or worse—than earlier customer groups.
Unit economics
Know Whether Growth Is Creating Economic Value
Acquisition growth should always be evaluated against the economics of the customers it produces.
Potential measures
- CAC
- LTV
- CAC payback
- Gross margin
- Customer lifetime
- Contribution margin
Customer acquisition cost answers what it costs to win a customer. Lifetime economics help management understand whether the resulting relationship creates enough value to justify that investment. Both depend on assumptions—retention, gross margin, and which costs are included—so the definitions should be documented and applied the same way each period.
Faster growth is not automatically better growth if acquisition economics deteriorate.
Sales capacity
Connect Sales Hiring to Revenue Capacity
Adding salespeople creates cost long before it creates revenue. Capacity planning makes that lag explicit.
Planning assumptions
- Sales headcount
- Quota
- Ramp time
- Attainment
- Conversion rates
- Pipeline coverage
- Average contract value
- Sales cycle
Sales capacity planning helps management understand when additional hiring is required and when the economics support it.
From headcount to revenue
- Sales headcount
- Ramp
- Productive capacity
- Pipeline
- Bookings
- ARR / revenue
Commercial funnel
Connect Commercial Activity to the Financial Forecast
Pipeline, bookings, backlog, revenue, and cash are related—but they are not interchangeable, and using them loosely distorts the forecast.
Funnel to cash
- Pipeline
- Opportunity conversion
- Booking
- Contract / backlog
- Revenue recognition
- Cash collection
Distinct measures management should separate
- Pipeline
- Bookings
- Backlog
- Contracted revenue
- Recognized revenue
- Cash collections
A strong forecast connects the sales funnel to recognized revenue and cash—not just bookings.
Gross margin
Recurring Revenue Quality Depends on Delivery Economics
Delivery cost varies widely by product, customer, and service tier—and it determines how much of recurring revenue actually reaches the bottom line.
Cost drivers
- Hosting
- Cloud infrastructure
- Implementation
- Customer support
- Third-party software
- Payment processing
- Professional services
- Labor
- Onboarding
Potential analysis
- Gross margin by product
- Gross margin by customer
- Service-tier economics
- Implementation profitability
- Support intensity
- Infrastructure cost
High recurring revenue is more valuable when delivery economics are scalable.
Customer- and product-level views make the differences visible. Explore profitability analysis.
Pricing & packaging
Use Financial Analysis to Support Pricing and Packaging Decisions
Potential decisions
- Seat-based pricing
- Usage-based pricing
- Tiered pricing
- Enterprise packages
- Annual vs. monthly plans
- Contract length
- Discounts
- Implementation fees
Analysis should consider
- ARR impact
- Customer behavior
- Gross margin
- Retention
- Expansion
- Cash flow
Pricing should reflect customer value, competitive positioning, and long-term economics—not simply cost plus margin.
Cash & runway
Understand How Much Growth the Business Can Fund
Technology and subscription businesses invest ahead of revenue. The planning question is not only how fast the company can grow, but how much growth it can fund.
Where growth capital goes
- Sales hiring
- Product development
- Engineering
- Marketing
- Customer success
- Infrastructure
- Acquisitions
Management should understand
- Cash burn
- Cash runway
- Break-even timing
- Financing needs
- Investment capacity
Runway view
- Beginning cash
- + Operating cash flow
- – Growth investment
- = Ending cash / runway
Growth planning should answer not only how fast the business can grow—but how much growth it can fund. See cash flow & working capital.
Operating leverage
Understand When Growth Should Create Operating Leverage
Headcount is typically the largest expense in a technology or subscription business, and the primary lever on whether growth improves margins.
Functions to analyze
- Engineering
- Product
- Sales
- Customer success
- Support
- G&A
Planning questions
- How fast can headcount grow relative to revenue?
- When should profit margins improve?
- Where are productivity gains expected?
- Which teams scale with customers versus revenue?
Operating leverage becomes visible when management connects headcount growth to revenue and gross profit growth.
KPI framework
Focus Management on the Metrics That Drive Recurring Revenue
Growth
- ARR
- MRR
- Bookings
- New ARR
- Expansion ARR
Retention
- Gross retention
- Net retention
- Logo churn
- Revenue churn
Sales
- Pipeline
- Conversion
- Quota attainment
- Sales productivity
Economics
- Gross margin
- CAC
- CAC payback
- LTV
- Contribution margin
Cash
- Operating cash flow
- Burn
- Runway
Planning
- Forecast accuracy
- Bookings forecast accuracy
- ARR forecast accuracy
The best KPI framework combines growth, retention, economics, and cash.
Forecasting
Build a Forecast That Reflects the Subscription Model
A subscription forecast should follow the customer base through revenue, margin, investment, and cash.
Forecast chain
- Beginning customers / ARR
- New sales
- Retention
- Expansion / contraction
- Revenue
- Gross margin
- Headcount
- Operating expenses
- Profit
- Cash
A recurring-revenue forecast should reflect customer behavior and operating investment—not just a percentage growth assumption.
Each link in the chain is an assumption management can debate, test, and hold accountable—retention rates, ramp times, hiring plans, and delivery cost. Financial forecasting and budgeting & planning describe how we build and maintain that model.
Scenario planning
Stress-Test Growth Before You Commit to It
Churn increases
What happens to ARR and cash?
Sales hiring accelerates
How much runway is consumed?
Quota attainment falls
What happens to bookings?
Pricing increases
How do retention and margin change?
New product investment
What revenue is required to justify the cost?
Growth slows
What cost actions may be needed?
Scenario planning helps management identify the assumptions that create the greatest financial risk.
Strategic decision support covers how these scenarios translate into specific management decisions.
Board reporting
Turn Operating Metrics Into Executive-Level Financial Insight
Board and investor packages work best when they explain the business, not just report it.
- ARR bridge
- Bookings
- Retention
- Churn
- Gross margin
- Cash runway
- Headcount
- Forecast
- Actual vs. plan
- Risks and opportunities
A strong board package should explain what changed, why it changed, and what management plans to do next.
Deliverables
Technology & Subscription FP&A Deliverables
- ARR / MRR forecast
- Revenue forecast
- Bookings forecast
- ARR bridge
- Retention analysis
- Churn analysis
- Cohort analysis
- CAC analysis
- LTV analysis
- CAC payback
- Gross-margin analysis
- Customer profitability
- Product profitability
- Sales capacity model
- Pipeline conversion model
- Headcount plan
- Cash runway forecast
- Scenario model
- Pricing model
- Board / investor reporting
- KPI dashboard
- Monthly operating review package
Engagement
Flexible FP&A Support for Technology Businesses
Focused Project
Best for:
- ARR model
- Unit economics
- Pricing
- Cash runway
- Sales capacity
- Scenario analysis
Fractional FP&A
Best for recurring:
- Forecasting
- KPI reporting
- Management reporting
- Planning
- Unit economics
- Decision support
Interim FP&A Leadership
Best for:
- Finance leadership vacancy
- Rapid growth
- PE transition
- Transaction
- Transformation
Fit
Built for Growing Technology & Subscription Businesses
Typical fit
- $10M–$100M revenue
- Privately held or PE-backed
- Recurring or contract-based revenue
- Existing accounting team
- Limited dedicated FP&A resources
- Rapid growth or increasing complexity
- Management seeking better visibility into recurring revenue economics
Particularly strong fit
- SaaS
- Software-enabled services
- Managed services
- Technology services
- Recurring-revenue business models
- Subscription businesses
- Membership-based models
- Technology-enabled professional services
Other industry pages
Greater Chicago & Midwest
Technology FP&A Support Across Greater Chicago and the Midwest
Northline FP&A supports privately held and PE-backed technology and subscription businesses in Chicago and the surrounding business communities.
- Chicago
- Naperville
- Oak Brook
- Downers Grove
- Lisle
- Schaumburg
- Northbrook
- Deerfield
Support extends more broadly across the Midwest through a combination of remote collaboration and on-site executive support where that is useful—working alongside an existing CFO, Controller, accounting team, or founder rather than replacing them.
Why Northline FP&A
Forward-Looking Finance for Recurring-Revenue Business Models
FP&A Focus
Concentrate on forecasting, analytics, and decision support rather than outsourced accounting.
Recurring-Revenue Orientation
Build financial analysis around bookings, ARR, retention, churn, and unit economics.
Senior-Level Finance Support
Work directly with CEOs, CFOs, Controllers, and operating leaders.
Hands-On Execution
Build and operate models, dashboards, forecasts, and management reporting.
Scalable Support
Engage through focused projects, fractional FP&A, or interim leadership as needs change.
Fractional FP&A
Ongoing FP&A capacity for recurring forecasting, reporting, and analysis.
Learn moreInterim FP&A Leadership
Senior coverage during vacancies, rapid growth, or transitions.
Learn moreFinancial Forecasting
Driver-based forecasts that connect customers, revenue, margin, and cash.
Learn moreCash Flow & Working Capital
Runway visibility, collections, and liquidity planning.
Learn moreProfitability Analysis
Customer, product, and service-tier economics including cost-to-serve.
Learn moreBudgeting & Planning
An annual plan built on realistic bookings, retention, and hiring assumptions.
Learn moreStrategic Decision Support
Pricing, packaging, sales expansion, and investment analysis.
Learn moreFP&A Maturity Assessment
A 10-dimension diagnostic of your finance function.
Learn moreFAQ
Technology & Subscription FP&A Questions
- What does FP&A do in a SaaS or subscription business?
- It connects recurring revenue, retention, sales capacity, gross margin, headcount, and cash into a single forward-looking plan. The goal is to translate customer behavior and operating investment into forecasts, analysis, and decisions management can act on.
- What is ARR?
- Annual recurring revenue is the annualized value of recurring contracted revenue. Definitions vary between companies, so ARR should be defined once—based on your contracts and business model—and applied consistently over time.
- What is MRR?
- Monthly recurring revenue is the recurring revenue expected in a given month. Like ARR, it is most useful when the definition is consistent and reconciles to reported revenue.
- What is churn?
- Churn measures customer or recurring-revenue loss over a period. Logo churn counts customers; revenue churn measures recurring dollars lost. Both should be defined consistently so trends are comparable period to period.
- What is net revenue retention?
- Net revenue retention measures how recurring revenue from an existing customer base changes after expansion, contraction, and churn. It shows whether the installed base grows or shrinks before any new customers are added.
- What is CAC?
- Customer acquisition cost estimates what it costs to win a new customer, typically including sales and marketing investment over a defined period. The included costs should be documented and applied consistently.
- What is LTV?
- Lifetime value estimates the economic value expected from a customer relationship. It depends on assumptions such as retention, expansion, and gross margin, so it is best used as a directional planning measure rather than a precise figure.
- Can you help with sales capacity planning?
- Yes. Sales capacity models connect headcount, ramp time, quota, attainment, pipeline coverage, and conversion to expected bookings—and to the cost and cash required to support that hiring.
- Can you help with SaaS forecasting?
- Yes. The forecast can connect bookings, ARR, retention, revenue, gross margin, headcount, operating expenses, profit, and cash so management sees the full effect of commercial and hiring assumptions.
- Can technology FP&A be fractional?
- Yes. Many growing technology and subscription businesses need sophisticated FP&A capability well before they need a full internal FP&A department.
Diagnostic
How Mature Is Your Technology FP&A Capability?
Evaluate your company's capabilities across ten dimensions of the finance function.
- Financial reporting
- Budgeting
- Forecasting
- Cash flow
- Revenue planning
- Profitability
- KPIs
- Scenario analysis
- Systems
- Finance partnership
Next step
Turn Recurring Revenue Data Into Better Business Decisions.
Build stronger visibility into ARR, retention, unit economics, cash, sales capacity, and future financial performance so management can pursue growth with greater discipline.
Serving technology and subscription businesses throughout Greater Chicago and the Midwest.