Greater Chicago & the Midwest
FP&A for Growing Manufacturing Businesses
Connect production, pricing, labor, materials, inventory, and customer economics to better financial decisions.
Northline FP&A helps privately held and PE-backed manufacturers improve forecasting, margin visibility, profitability analysis, cash planning, and operational decision support.
Experienced in manufacturing environments including food, candy & confectionery, and broader consumer goods.
- Margin & mix analysis
- Product & customer profitability
- Inventory & working capital
- Production-linked forecasting
Designed for growing manufacturers generally between $10M and $100M in annual revenue.
The challenge
Manufacturing Profitability Is Driven Far Beyond the Income Statement
Manufacturers manage a combination of commercial, operational, and financial variables at the same time. The financial statements report the result, but they rarely explain the cause.
Common drivers
- Material input costs
- Direct labor
- Overtime
- Production efficiency
- Yield
- Scrap
- Throughput
- Downtime
- Product mix
- Pricing
- Freight
- Inventory
- Customer terms
- Capital spending
A small change in price, yield, labor efficiency, or mix can materially change profit.
Strong FP&A helps management connect operational changes to financial outcomes—so a shift in production performance or customer mix is visible in margin, inventory, and cash before it shows up as a surprise at month end.
Five manufacturing questions
Can Your Finance Function Answer These Questions Quickly?
Which products and customers generate the strongest contribution margin?
Why did gross margin change this month?
How much profitability is being gained or lost through price, volume, mix, labor, and material costs?
How much cash is tied up in inventory and working capital?
When does additional capacity or capital investment become financially justified?
Manufacturing FP&A should translate shop-floor and commercial activity into management economics.
Warning signs
Signs Your Manufacturing FP&A Capability Needs Improvement
- Management sees total gross margin but cannot explain the drivers.
- Product profitability is difficult to measure.
- Customer profitability is unclear.
- Standard costs are outdated or not decision-useful.
- Price increases are not tracked against material and labor inflation.
- Scrap, yield, or labor variance is not connected to profit impact.
- Inventory grows without clear explanation.
- Production and finance forecasts do not align.
- Sales forecasts are disconnected from production capacity.
- Capital investments are approved without clear return analysis.
- Product mix changes create unexpected margin shifts.
- Finance reporting is heavily manual.
- Management relies on plant or operational intuition rather than integrated analysis.
If several of these conditions exist, the business may have an FP&A visibility gap rather than an accounting problem.
Core capabilities
Financial Planning Built Around How Manufacturing Actually Works
Revenue & Demand Planning
- Customer demand
- Orders
- Backlog
- Pricing
- Volume
- Product mix
- Seasonality
- Customer concentration
Margin & Cost Analysis
- Material cost
- Direct labor
- Freight
- Overhead
- Contribution margin
- Gross margin
- Cost inflation
- Standard versus actual cost
Operational Performance
- Yield
- Scrap
- Downtime
- Overtime
- Throughput
- Labor efficiency
- Capacity utilization
Inventory & Working Capital
- Raw materials
- WIP
- Finished goods
- Turns
- Obsolete inventory
- Receivables
- Payables
- Cash conversion
Forecasting & Planning
- Rolling forecasts
- Production-linked forecasts
- Headcount
- CapEx
- Cash flow
- Scenarios
Strategic Decision Support
- Pricing
- Capital investment
- Capacity expansion
- Outsourcing
- SKU rationalization
- Customer decisions
- Acquisitions
Margin bridge
Understand Why Margin Changed
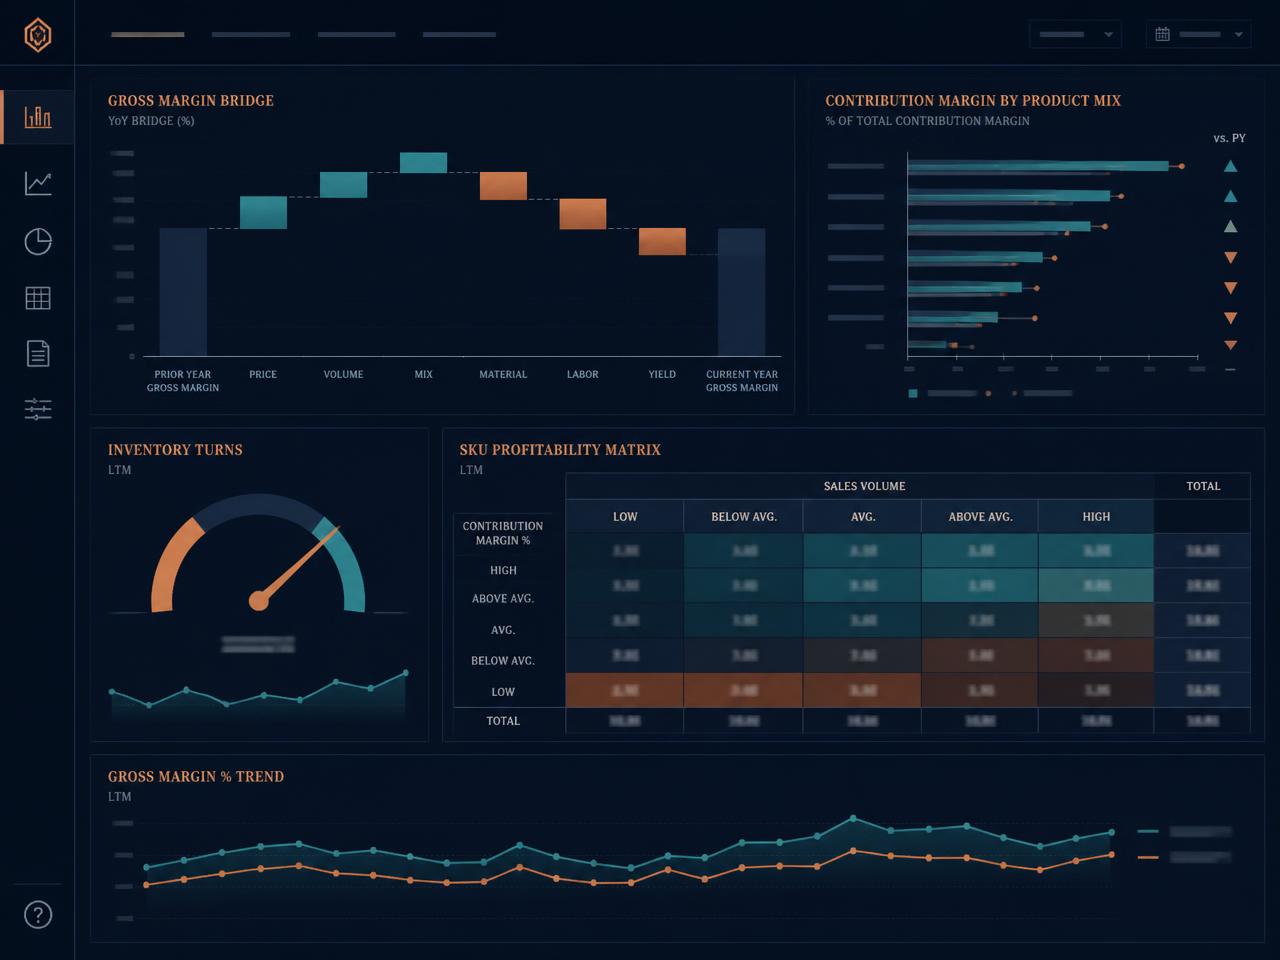
A gross-margin bridge separates the movement between two periods into the drivers management can actually act on.
Gross-margin bridge
- Prior period gross margin
- Price
- Volume
- Mix
- Material cost
- Labor
- Yield / scrap
- Freight / other
- Current gross margin
Management should be able to distinguish
- Pricing gains
- Commodity inflation
- Mix shifts
- Production inefficiency
- Freight changes
- Labor pressure
Knowing margin changed is useful. Knowing why it changed is actionable.
Product profitability
Know Which Products Actually Create Value
Product economics should reflect more than selling price less material cost.
What product profitability should consider
- Selling price
- Material cost
- Labor
- Packaging
- Freight
- Production efficiency
- Changeover complexity
- Scrap
- Capacity usage
- Promotional activity
High Margin / High Volume
Protect & Grow
High Margin / Low Volume
Expand Selectively
Low Margin / High Volume
Improve Economics
Low Margin / Low Volume
Reprice, Simplify, or Rationalize
A high-revenue SKU is not necessarily a high-value SKU.
Customer profitability
Your Largest Customer May Not Be Your Most Profitable Customer
Customer economics vary widely once the full cost of serving the relationship is considered.
Factors that move customer margin
- Price
- Product mix
- Freight
- Deductions
- Rebates
- Payment terms
- Service requirements
- Returns
- Promotional spending
- Custom packaging
- Order frequency
Customer profitability should reflect both what the customer buys and what it costs the organization to serve them.
Our profitability analysis work builds these customer and product views alongside cost-to-serve.
Pricing
Understand Whether Pricing Is Keeping Pace With Cost
Common cost pressures
- Raw-material inflation
- Wage inflation
- Freight changes
- Packaging cost increases
- Energy costs
- Supplier price changes
What pricing analysis examines
- Price realization
- Contract pricing
- Customer-specific pricing
- Timing lag
- Margin recovery
- Volume sensitivity
Price recovery chain
- Cost increase
- Required price recovery
- Expected volume response
- Margin impact
Pricing analysis should measure realized margin recovery—not simply announced price increases.
Operational efficiency
Translate Operational Efficiency Into Financial Impact
Operational inputs
- Labor hours
- Overtime
- Staffing
- Utilization
- Throughput
- Downtime
- Changeovers
- Scrap
- Yield
Financial outcomes
- Unit cost
- Gross margin
- Contribution margin
- Profit
Questions finance should answer
- What is the profit impact of a 2% improvement in yield?
- What does overtime cost the business?
- When does another production shift become economically attractive?
- What is the cost of downtime?
Operational improvement becomes more actionable when management can quantify the financial value.
Inventory & working capital
Inventory Is Both an Operating Asset and a Cash Investment
Manufacturing inventory sits across raw materials, work in process, and finished goods—each with its own planning behavior and cash implications.
Inventory categories
- Raw materials
- WIP
- Finished goods
What we analyze
- Inventory turns
- Aging
- Slow-moving inventory
- Obsolete inventory
- Safety stock
- Purchasing patterns
- Production planning
- Working capital
The operating cash cycle
- Raw materials
- WIP
- Finished goods
- Sale
- Receivable
- Cash
The longer cash remains in the operating cycle, the more capital the business must fund.
See our cash flow & working capital approach for 13-week forecasting and cash conversion planning.
Specialization
FP&A for Food, Candy & Confectionery Manufacturers
Food and confectionery businesses carry additional financial complexity. Our role is to express that complexity in planning and analysis terms—not to advise on commodities, food safety, or production processes.
Sources of added complexity
- Commodity input costs
- Sugar
- Cocoa
- Dairy
- Oils
- Nuts
- Packaging
- Seasonality
- Promotions
- Retailer programs
- Customer deductions
- Spoilage
- Shelf life
- Production yields
- Product mix
- Plant capacity
How FP&A connects these drivers
- Revenue
- Gross margin
- Inventory
- Cash
- Pricing
- Profitability
In food and confectionery, small changes in commodity costs, yield, mix, or promotional activity can materially change product and customer economics.
CPG
FP&A for Consumer Packaged Goods Businesses
CPG economics are shaped as much by customers, channels, and trade programs as by the product itself.
Common CPG financial complexity
- Retailer concentration
- Channel mix
- Customer deductions
- Trade spending
- Promotions
- Slotting or program costs
- Freight
- Product mix
- New product launches
- Packaging
- Inventory
- Seasonality
FP&A views that help
- Customer P&L
- Product P&L
- Channel profitability
- Promotional ROI
- Trade-spend analysis
- New-product economics
- Margin bridge
Top-line growth matters, but profitable growth requires understanding the economics by customer, product, and channel.
Trade spend
Measure the Economics Behind Promotions
Promotional activity should be evaluated on incremental contribution, not incremental revenue alone. Where underlying data is limited, the analysis should be framed accordingly.
What we evaluate
- Baseline volume
- Promotional lift
- Discount
- Trade spend
- Product margin
- Incremental contribution
- Cannibalization where measurable
- Post-promotion behavior
A promotion that increases revenue does not automatically increase profit.
SKU portfolio
Complexity Has a Cost
What large SKU portfolios create
- Production changeovers
- Small batch runs
- Excess inventory
- Forecasting complexity
- Packaging complexity
- Procurement complexity
- Low-volume economics
What the analysis considers
- SKU revenue
- Margin
- Volume
- Customer dependence
- Operational complexity
- Inventory
- Strategic relevance
SKU rationalization is not simply about eliminating low-volume products. It is about understanding whether complexity creates sufficient economic value.
Capacity & capital
Know When Additional Capacity Is Financially Justified
Decisions we support
- New equipment
- Automation
- Additional shift
- Plant expansion
- New production line
- Warehouse capacity
- Outsourced production
Typical analysis
- Investment
- Incremental capacity
- Volume assumptions
- Labor savings
- Margin
- Working capital
- Cash flow
- Payback
- ROI
The right capacity decision depends on both operating need and financial return.
These evaluations are part of our strategic decision support work.
Forecasting
Connect Demand, Production, and Financial Forecasts
The forecast chain
- Sales / demand
- Production
- Materials
- Labor
- Inventory
- Revenue & margin
- Cash
Common disconnects
- Sales forecasts not reflected in production.
- Production plans not connected to inventory.
- Headcount plans not connected to demand.
- Price changes not reflected in margin.
- CapEx decisions not reflected in cash.
The financial forecast should reflect how the plant and commercial organization actually plan to operate.
Learn more about our financial forecasting and budgeting & planning services.
Deliverables
Manufacturing FP&A Deliverables
- Driver-based revenue forecast
- Product profitability
- Customer profitability
- Gross-margin bridge
- Price / volume / mix analysis
- Material-cost analysis
- Labor-variance analysis
- Yield / scrap financial analysis
- Inventory dashboard
- Working-capital analysis
- Production-linked financial forecast
- Capacity model
- CapEx model
- Pricing analysis
- SKU profitability
- Customer P&Ls
- CPG channel analysis
- Promotional profitability analysis
- Executive KPI dashboard
- Monthly operating review package
KPI framework
Connect Operational KPIs to Financial Results
Commercial
- Revenue
- Price
- Volume
- Mix
- Backlog / orders
- Customer concentration
Margin
- Gross margin
- Contribution margin
- Material variance
- Labor variance
- Freight
- Price realization
Operations
- Yield
- Scrap
- Throughput
- Overtime
- Downtime
- Capacity utilization
Working Capital
- Inventory turns
- DSO
- DPO
- Cash conversion cycle
Planning
- Forecast accuracy
- Production forecast accuracy
- Revenue forecast accuracy
The most useful KPI framework links operating performance to financial outcomes.
Engagement
Flexible FP&A Support for Manufacturers
Focused Project
Best for:
- Profitability
- Pricing
- Inventory
- CapEx
- Forecasting
- Margin analysis
Fractional FP&A
Best for recurring:
- Forecasting
- Management reporting
- KPI analysis
- Profitability
- Business partnership
Interim FP&A Leadership
Best for:
- Finance leadership vacancy
- Transformation
- Acquisition
- PE transition
- Rapid growth
Fit
Built for Growing Manufacturing Businesses
Typical fit
- $10M–$100M revenue
- Privately held or PE-backed
- Existing accounting team
- Limited dedicated FP&A capacity
- Multiple products, customers, or facilities
- Meaningful inventory or production complexity
- Management seeking better forward visibility
Particularly strong fit
- Food manufacturing
- Candy and confectionery
- Consumer packaged goods
- General manufacturing
- Specialty manufacturing
- Multi-product environments
Other industry pages
Greater Chicago & Midwest
Manufacturing FP&A Support Across Greater Chicago and the Midwest
Northline FP&A supports privately held manufacturers in Chicago and the surrounding business communities, combining remote analysis with on-site collaboration where that is useful.
- Chicago
- Naperville
- Oak Brook
- Downers Grove
- Lisle
- Schaumburg
- Aurora
- Bolingbrook
- Elgin
- Northbrook
Support extends more broadly across the Midwest, including manufacturers in northern Illinois, Wisconsin, Indiana, and Michigan—particularly those operating multiple plants, product lines, or distribution points.
Why Northline FP&A
Finance Experience That Understands Operational Businesses
Manufacturing Orientation
Focus on the relationship between operations, commercial activity, margin, inventory, and cash.
Food, Candy & CPG Experience
Practical familiarity with businesses where product mix, commodity inputs, customer economics, promotions, and production efficiency materially affect financial performance.
Senior-Level Finance Support
Work directly with CEOs, CFOs, Controllers, and operating leaders.
Hands-On Analysis
Build and operate models, dashboards, forecasts, and management reporting.
Scalable Support
Engage through project work, fractional FP&A, or interim leadership as needs change.
Fractional FP&A
Ongoing FP&A capacity for manufacturers that need recurring forecasting and reporting.
Learn moreInterim FP&A Leadership
Senior coverage during vacancies, transitions, or acquisitions.
Learn moreFinancial Forecasting
Driver-based forecasts that connect demand, production, margin, and cash.
Learn moreCash Flow & Working Capital
Liquidity planning across inventory, receivables, payables, and the cash cycle.
Learn moreProfitability Analysis
Product, SKU, and customer economics including cost-to-serve.
Learn moreBudgeting & Planning
An annual plan built on realistic volume, mix, cost, and capacity assumptions.
Learn moreStrategic Decision Support
Capacity, CapEx, pricing, outsourcing, and acquisition analysis.
Learn moreFP&A Maturity Assessment
A 10-dimension diagnostic of your finance function.
Learn moreFAQ
Manufacturing FP&A Questions
- What does FP&A do in a manufacturing company?
- Manufacturing FP&A connects demand, production, material and labor costs, inventory, pricing, and capital planning to financial outcomes. It translates operational and commercial activity into forecasts, margin analysis, and decision support management can act on.
- What financial metrics matter most for manufacturers?
- Revenue, gross margin, contribution margin, material cost, labor, yield, scrap, inventory, working capital, cash, and forecast accuracy are the metrics that most consistently explain financial performance in a manufacturing business.
- Can you help with product profitability?
- Yes. Product and SKU profitability can incorporate price, material and labor cost, packaging, freight, production efficiency, changeover complexity, scrap, and capacity usage at the level of detail your data reasonably supports.
- Can you help analyze customer profitability?
- Yes. Customer profitability views can reflect price, mix, freight, deductions, rebates, terms, service requirements, and promotional spending so management can see what each relationship actually contributes.
- Can you help with manufacturing pricing decisions?
- Yes. Pricing analysis can evaluate price realization, material and labor cost changes, volume sensitivity, contract and customer-specific pricing, and the resulting margin implications.
- Can you help with inventory and working capital?
- Yes. Analysis covers raw materials, WIP, and finished goods along with turns, aging, slow-moving and obsolete inventory, safety stock, receivables, payables, and the cash conversion cycle.
- Can you support food or CPG manufacturers?
- Yes. Northline FP&A has relevant finance experience in food, candy and confectionery, and CPG environments and can support the financial planning and analytical needs common to those businesses—commodity cost impact, promotions, deductions, mix, and SKU complexity expressed in financial terms.
- Do you replace our plant finance team or Controller?
- No. The service is designed to complement existing accounting, finance, and operating teams by adding analytical capacity and forward-looking decision support.
- Can manufacturing FP&A be fractional?
- Yes. Many $10M–$100M manufacturers need recurring FP&A capability—forecasting, reporting, margin and profitability analysis—without building a full internal FP&A department.
Diagnostic
How Mature Is Your Manufacturing FP&A Capability?
Evaluate your company's capabilities across ten dimensions of the finance function.
- Financial reporting
- Budgeting
- Forecasting
- Cash flow
- Revenue planning
- Profitability
- KPIs
- Scenario analysis
- Systems
- Finance partnership
Next step
Turn Manufacturing Data Into Better Financial Decisions.
Build stronger visibility into product and customer profitability, margin drivers, inventory, cash, forecasting, and capital decisions so management can focus on profitable growth.
Serving manufacturing businesses throughout Greater Chicago and the Midwest, with particular experience relevant to food, candy, confectionery, and CPG companies.