Greater Chicago & the Midwest
Profitability Analysis for Growing Businesses
Know where your business actually makes money.
We help privately held and PE-backed businesses understand customer, product, service, project, branch, and business-unit profitability so management can make better pricing, growth, resource-allocation, and margin decisions.
- Customer profitability
- Product & service margin
- Cost-to-serve
- Price / volume / mix
Designed for growing businesses generally between $10M and $100M in annual revenue. Serving businesses throughout Greater Chicago and the Midwest.
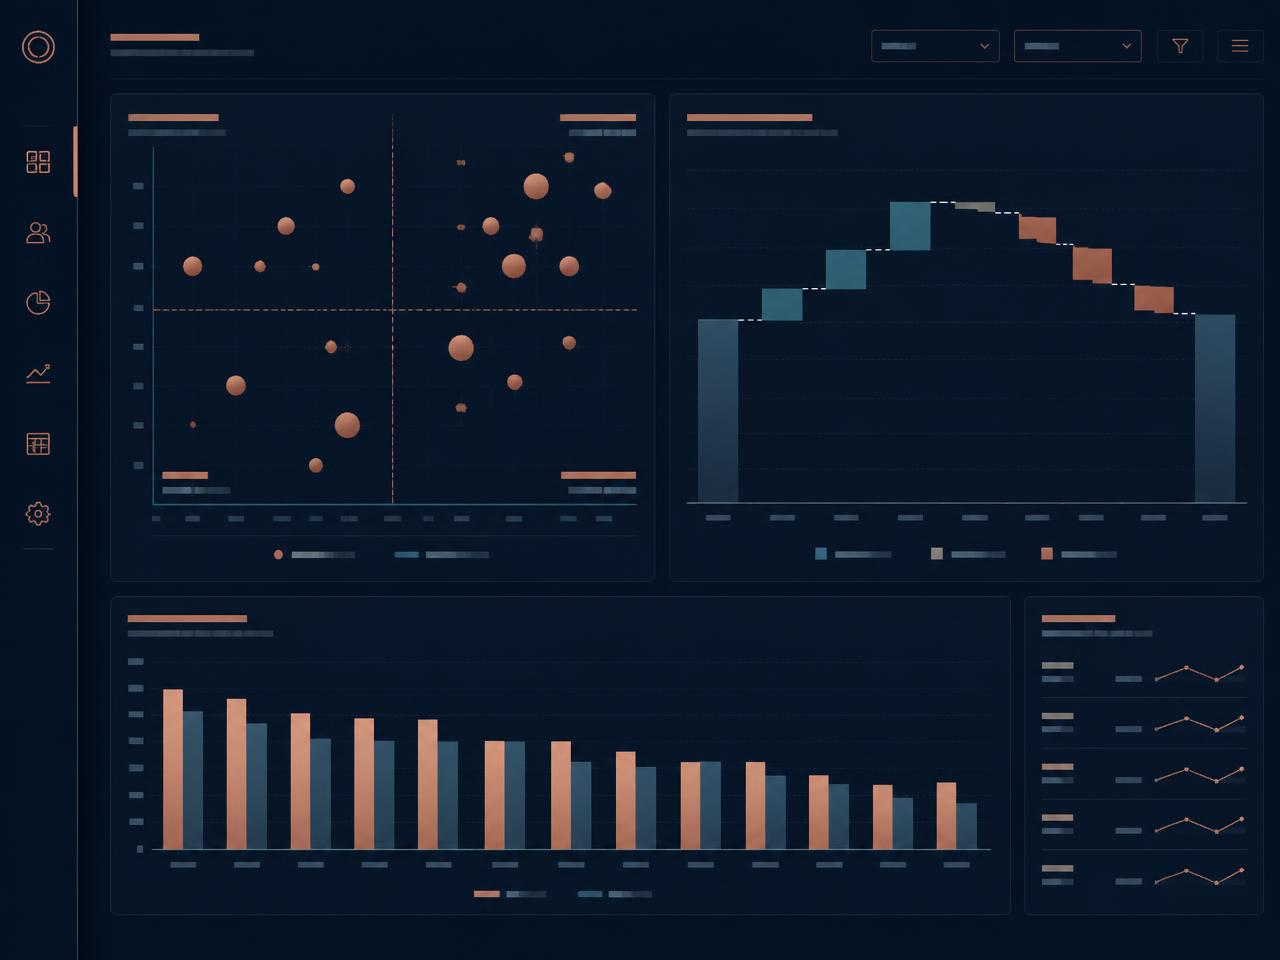
The core problem
Your Largest Customer May Not Be Your Most Profitable Customer
Most management teams know total revenue and total gross margin. Far fewer can say which customers, products, services, projects, or locations actually create the most economic value—and which quietly consume it.
Where margin commonly hides
- Discounting
- Excessive service requirements
- Freight and delivery costs
- Low utilization
- Customer-specific support
- Returns and credits
- Inefficient product mix
- Overtime
- Project overruns
- Low-volume complexity
- Unfavorable contract terms
Revenue tells you how big the relationship is. Profitability tells you how valuable it is.
Revenue growth does not always equal profitable growth. Two accounts of the same size can produce very different economics once discounting, service effort, freight, and complexity are considered.
Five profitability questions
Can Your Finance Function Answer These Questions Confidently?
Which customers generate the most profit—not just the most revenue?
Which products or services create the strongest contribution margin?
Where are we losing margin through pricing, mix, or cost-to-serve?
Which locations, projects, or business units are creating—or destroying—value?
What actions could improve margin without relying only on more revenue growth?
A strong profitability model should help management decide where to grow, where to improve, and where to stop investing.
Warning signs
Signs Your Profitability Visibility Needs Improvement
- Management primarily reviews total company gross margin.
- Customer profitability cannot be measured reliably.
- Product or service-line margins are unclear.
- Large customers receive discounts without understanding full economics.
- Freight, service, support, or delivery costs are not assigned meaningfully.
- Project profitability is known only after completion.
- Business-unit or branch results rely on arbitrary allocations.
- Pricing decisions are made without a clear margin floor.
- Management focuses heavily on revenue growth but less on contribution margin.
- The company cannot explain why margin changes from one period to the next.
- Low-volume products or customers create significant complexity.
- Margin-improvement actions are not tracked to financial results.
If several of these conditions exist, the business may have a profitability insight gap—not simply a pricing problem.
What good looks like
Profitability Should Reflect the Economics of How the Business Actually Operates
Revenue Visibility
Understand what is actually earned:
- Price
- Volume
- Mix
- Discounts
- Credits
- Rebates
- Contract terms
Cost Visibility
Understand what delivery actually consumes:
- Direct labor
- Materials
- Freight
- Commissions
- Service costs
- Support costs
- Project delivery
- Operational effort
Appropriate Cost Allocation
Allocate only where it improves understanding:
- Use allocations that reflect real cost drivers
- Avoid forcing every overhead dollar into customer or product views
- Keep methodology transparent to operating leaders
Decision Relevance
The analysis should help management decide:
- Where to invest
- Where to raise price
- Where to reduce cost
- Where to change service levels
- Where to exit
The goal is not perfect cost accounting. The goal is better economic decision-making.
Customer profitability
Understand the True Economics of Each Customer Relationship
Customers with similar revenue can produce very different levels of profitability. The difference usually shows up in how the relationship is priced and how much effort it takes to serve.
Factors that move customer margin
- Pricing
- Volume
- Product mix
- Freight
- Sales commissions
- Service intensity
- Returns
- Payment behavior
- Customization
- Account-management requirements
High Revenue / High Profit
Protect & Grow
High Revenue / Low Profit
Improve Economics
Low Revenue / High Profit
Expand Where Possible
Low Revenue / Low Profit
Reprice, Simplify, or Exit
Customer profitability turns account management into an economic decision—not just a revenue decision.

Product & service profitability
Which Products and Services Actually Create Value?
Product and service profitability should evaluate more than selling price less direct cost. Operational effort, complexity, and capacity all shape the real economics.
Product businesses
- Unit margin
- Contribution margin
- Labor requirements
- Support intensity
- Freight
- Complexity
- Returns
- Capacity usage
- Customer mix
Service businesses
- Billable rate
- Utilization
- Realization
- Delivery labor
- Subcontractor cost
- Project scope
- Rework
A high-margin product on paper may still consume disproportionate operational capacity.
Contribution margin
Move Beyond Gross Margin to Understand Contribution
Gross margin
Revenue less the direct cost of goods or services.
Contribution margin
Revenue less the costs that change meaningfully with the sale or delivery of that customer, product, service, or project.
Where contribution margin helps
- Pricing
- Product mix
- Capacity decisions
- Customer prioritization
- Incremental growth decisions
The margin stack
- Revenue
- –Variable / direct costs
- =Contribution margin
- –Fixed operating costs
- =Operating profit
Cost-to-serve
Not Every Dollar of Revenue Costs the Same to Deliver
Cost-to-serve captures the effort behind the revenue: how often a customer orders, how far product travels, how much support and customization the relationship requires.
Common cost drivers
- Number of orders
- Order size
- Delivery distance
- Freight
- Customization
- Service calls
- Account-management time
- Returns
- Payment terms
- Technical support
- Implementation support
Typical applications
- Pricing decisions
- Minimum order requirements
- Service tiers
- Freight policies
- Account segmentation
- Contract renewal decisions
Two customers with the same revenue can have very different economics once cost-to-serve is considered.
Price / volume / mix
Understand Why Revenue and Margin Changed
Changes in revenue and margin should be separated into their drivers so management can respond to the cause rather than the symptom.
- Prior period revenue / margin
- Price impact
- Volume impact
- Mix impact
- Cost impact
- Current period revenue / margin
What the bridge distinguishes
- Real pricing gains
- Volume growth
- Mix deterioration
- Input-cost pressure
- Operational inefficiency
Knowing that margin declined is useful. Knowing why it declined is actionable.
Pricing analytics
Make Pricing Decisions With Better Financial Visibility
What pricing analysis covers
- Minimum acceptable margin
- Customer-specific economics
- Discount impact
- Inflation recovery
- Contract profitability
- Service-level economics
- Break-even volume
- Price sensitivity scenarios
Example decision questions
- How much price increase is needed to offset a 5% cost increase?
- What volume loss can the business tolerate after a price increase?
- Which customers are below minimum margin?
- Which discounts create insufficient return?
Pricing should reflect value, market conditions, and economics—not just cost plus a percentage.
Growth strategy
Grow the Parts of the Business That Create the Most Value
Decisions profitability analysis supports
- Customer selection
- Sales targeting
- Product strategy
- Channel strategy
- Pricing
- Capital allocation
- Acquisitions
- Service expansion
Revenue growth
Margin quality
Capital efficiency
=
Value-creating growth
Profitable growth requires understanding both how fast the business is growing and the economics of that growth.

Our process
A Practical Profitability Analysis Process
Step 1
Define
Identify the management questions that need to be answered—which customers are most profitable, which services to grow, where to raise price.
Step 2
Map
Identify revenue data, cost data, operational drivers, and any allocation requirements.
Step 3
Analyze
Build profitability views at the level that matters—customer, product, service, project, branch, or business unit.
Step 4
Validate
Review results with finance and operating leaders so the numbers reflect how the business actually runs.
Step 5
Act
Translate insights into pricing actions, cost actions, customer strategies, resource allocation, and growth priorities.
The analysis is valuable only if it leads to decisions.
Deliverables
Profitability Analysis Deliverables
- Customer profitability model
- Product profitability model
- Service-line profitability
- Project profitability
- Business-unit profitability
- Branch or location profitability
- Contribution margin analysis
- Cost-to-serve analysis
- Price / volume / mix bridge
- Margin bridge
- Pricing analysis
- Customer segmentation
- Low-margin account identification
- Margin opportunity dashboard
- Executive profitability summary
When to bring in support
When Should You Bring in Profitability Analysis Support?
- Revenue is growing but EBITDA is not.
- Gross margin is declining.
- Management suspects certain customers are unprofitable.
- Pricing has not kept pace with cost increases.
- Business complexity is increasing.
- The company has multiple branches or business units.
- A PE sponsor is pursuing EBITDA improvement.
- Management is evaluating which products or services to grow.
- Existing reporting is too high-level.
- The CFO or Controller lacks analytical capacity.
The service complements existing finance and accounting teams by providing deeper analytical capacity and decision support. The intent is to identify where margin improvement opportunities may exist and quantify the potential financial impact of management actions.
Fractional FP&A
Ongoing FP&A capacity where profitability analysis becomes part of the monthly rhythm.
Learn moreInterim FP&A Leadership
Senior coverage during vacancies, transitions, or acquisitions.
Learn moreFinancial Forecasting
Driver-based forecasts and scenarios that carry margin assumptions forward.
Learn moreCash Flow & Working Capital
Liquidity planning that connects margin performance to cash generation.
Learn moreBudgeting & Planning
An annual plan built on realistic margin and mix assumptions.
Learn moreFP&A Maturity Assessment
A 10-dimension diagnostic of your finance function, including profitability analytics.
Learn moreFAQ
Profitability Analysis Questions
- What is customer profitability analysis?
- It evaluates the revenue, direct costs, and relevant cost-to-serve associated with individual customers or customer groups, so management can see the economics of each relationship rather than only its size.
- How is contribution margin different from gross margin?
- Gross margin typically reflects revenue less the direct cost of goods or services. Contribution margin may include additional variable or attributable costs—freight, commissions, service effort—that are relevant to a specific management decision.
- Do we need perfect cost accounting before performing profitability analysis?
- No. The objective is decision-useful insight, and the appropriate level of precision depends on the question management is trying to answer. Many useful views can be built from existing ERP, accounting, and operational data.
- Can you analyze profitability by customer?
- Yes. Customer and customer-group profitability is one of the most common starting points, often paired with cost-to-serve and pricing analysis.
- Can you analyze profitability by product or service?
- Yes. Product, SKU, service-line, and project views are all supported, at the level of detail the underlying data reasonably supports.
- What is cost-to-serve?
- Cost-to-serve measures the costs associated with serving a customer beyond basic product cost—freight, support, customization, returns, and account-management effort among them.
- Can profitability analysis help with pricing?
- Yes. Profitability data informs margin floors, customer-specific decisions, discount analysis, inflation recovery, and price scenarios so pricing conversations start from economics rather than intuition.
- Will the analysis tell us which customers to eliminate?
- The analysis provides economic visibility. Management can then evaluate pricing, service levels, growth potential, strategic importance, and relationship considerations before making customer decisions.
- Can profitability analysis be part of an ongoing fractional FP&A engagement?
- Yes. Profitability analysis often becomes part of recurring performance management, refreshed alongside forecasting and reporting rather than performed once and set aside.