Greater Chicago & the Midwest
FP&A for Professional Services Businesses
Connect people, utilization, pricing, backlog, and project economics to better financial decisions.
Northline FP&A helps privately held and PE-backed professional-services businesses throughout Greater Chicago and the Midwest improve forecasting, profitability visibility, headcount planning, cash management, and strategic decision support.
Built for people-intensive and project-based businesses where labor productivity and pricing directly drive financial performance.
- Utilization & capacity analytics
- Rate & realization visibility
- Project and client profitability
- Headcount and cash planning
Designed for growing businesses generally between $10M and $100M in annual revenue.
The challenge
In a Service Business, People Are Often the Largest Asset—and the Largest Cost
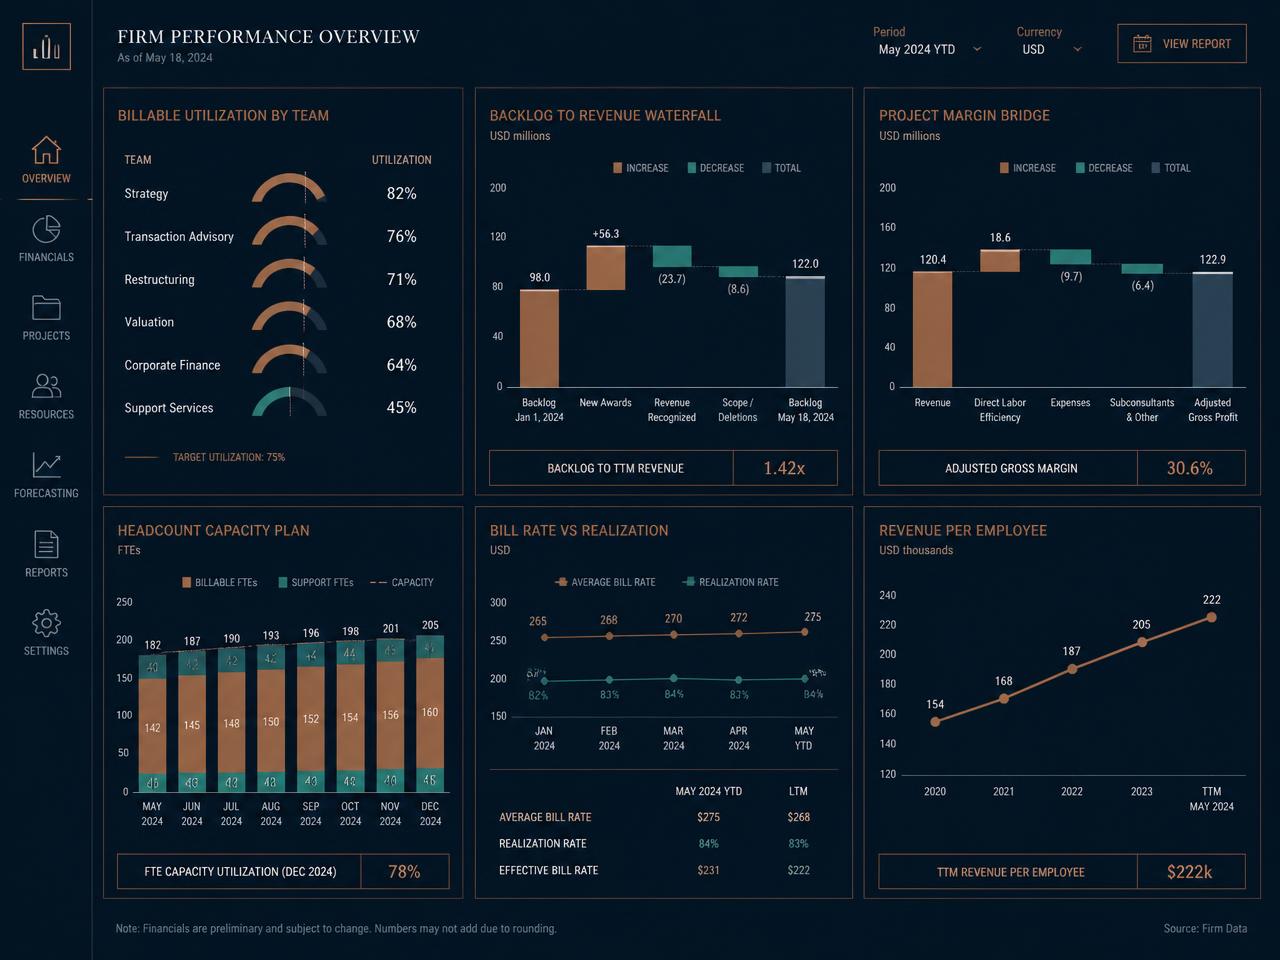
Professional-services companies typically depend on a relatively small number of operating drivers. Revenue is the outcome; workforce productivity, pricing, and delivery efficiency are the causes.
Common drivers
- Headcount
- Billable utilization
- Bill rates
- Realization
- Project mix
- Backlog
- Staffing mix
- Subcontractors
- Sales pipeline
- Customer concentration
- Hiring timing
- Compensation
- Project delivery efficiency
A small change in utilization, pricing, or staffing mix can materially change profit.
Strong FP&A translates those operating drivers into financial outcomes—so management can see, in advance, what a few points of utilization or a modest rate increase are worth.
Five professional services questions
Can Your Finance Function Answer These Questions Quickly?
What level of utilization is required to achieve the margin plan?
Which clients and projects generate the strongest contribution margin?
How much additional headcount can the business support?
Is backlog sufficient to support current staffing levels?
How much margin improvement could come from pricing, utilization, or staffing mix?
Professional-services FP&A should connect workforce productivity and commercial activity to financial performance.
Warning signs
Signs Your Professional Services FP&A Capability Needs Improvement
- Utilization is reported but not connected to financial outcomes.
- Bill rates and realization are not analyzed together.
- Project profitability is known only after work is completed.
- Backlog is not integrated into the revenue forecast.
- Hiring decisions are made without a clear view of revenue capacity.
- Revenue growth outpaces profit growth.
- Customer profitability is unclear.
- Subcontractor economics are difficult to measure.
- Sales pipeline is disconnected from workforce planning.
- Finance cannot explain why project margins changed.
- Headcount planning is maintained separately from the financial forecast.
- Management relies heavily on spreadsheets for staffing and profitability analysis.
- Forecast accuracy is not measured.
If several of these conditions exist, the company may have a financial visibility gap rather than an accounting problem.
Core capabilities
Financial Planning Built Around the Economics of People and Projects
Revenue & Backlog Planning
- Backlog
- Pipeline
- Project starts
- Contract value
- Project duration
- Renewal activity
- New business
Utilization & Productivity
- Billable utilization
- Productive hours
- Non-billable time
- Capacity
- Labor efficiency
- Revenue per employee
Pricing & Realization
- Standard rates
- Realized rates
- Discounts
- Project pricing
- Client-specific pricing
- Rate increases
Project & Client Profitability
- Project margin
- Client margin
- Labor mix
- Subcontractors
- Scope creep
- Cost-to-serve
Headcount & Workforce Planning
- Hiring
- Open positions
- Start dates
- Compensation
- Staffing mix
- Capacity planning
Strategic Decision Support
- Hiring
- Pricing
- Outsourcing
- Geographic expansion
- New service lines
- Acquisitions
Utilization
Understand the Financial Value of Utilization
Utilization is one of the most important drivers in a people-intensive business—but it is only useful when it is tied to margin.
Potential analysis
- Available hours
- Billable hours
- Productive hours
- Utilization by employee
- Utilization by team
- Utilization by service line
- Utilization by location
The financial connection
- Higher utilization
- More billable capacity
- More revenue per employee
- Higher contribution margin
The objective is not maximum utilization at all costs.
Management should balance utilization with service quality, business development, training, and sustainable workload. Utilization pushed too far eventually shows up as turnover, write-offs, and lost pipeline.
The most useful utilization analysis connects workforce productivity to financial performance.
Rates & realization
Published Rates Matter Less Than Realized Economics
Bill rate
The contractual or stated rate for the work.
Realization
The actual revenue earned relative to the potential billable value of the work.
A higher rate creates little value if poor realization gives the economics back.
Factors that reduce realization
- Discounts
- Write-offs
- Scope creep
- Fixed-fee overruns
- Unbilled work
- Client concessions
Potential analysis
- Standard rate vs. actual rate
- Rate realization
- Discounting
- Write-offs
- Project-level economics
Project profitability
Know Whether Projects Are Making Money Before They End
Project margin should be monitored during delivery, not reconstructed after the final invoice.
Potential components
- Contract value
- Billed revenue
- Earned revenue
- Labor hours
- Labor cost
- Subcontractors
- Travel
- Other direct costs
- Change orders
- Estimated cost to complete
Project margin bridge
- Original project margin
- Scope changes
- Labor variance
- Rate / realization
- Cost changes
- Expected final margin
The best time to discover a project-margin issue is while management can still influence the outcome.
Profitability analysis describes how we build project, client, and service-line margin views that reconcile to the P&L.
Client profitability
Not Every Client Relationship Creates the Same Value
Why client economics differ
- Pricing
- Service intensity
- Utilization
- Seniority mix
- Travel
- Project complexity
- Write-offs
- Collection timing
- Account-management effort
Strategic / high profit
Protect and grow.
High revenue / low margin
Improve pricing or delivery economics.
High growth potential
Invest selectively.
Low value / high complexity
Reprice, simplify, or reevaluate.
Client profitability should consider both financial contribution and strategic value.
Backlog
Turn Backlog Into a More Reliable Revenue Forecast
Service businesses often carry committed work that has not yet been delivered. The forecast question is when—and with which people—it converts.
Backlog roll-forward
- Beginning backlog
- + New bookings
- – Revenue delivered
- = Ending backlog
A strong forecast considers
- Beginning backlog
- Expected delivery timing
- New bookings
- Project duration
- Utilization
- Capacity
- Customer delays
- Cancellations where relevant
Backlog + capacity + delivery timing = revenue forecast
Backlog is valuable only when management understands when it can be converted into revenue. See our forecasting approach.
Headcount planning
Hire Ahead of Demand Without Getting Too Far Ahead of Revenue
Professional-services firms face a persistent timing problem: capacity has to exist before the revenue it produces.
Hire too late
- Service quality suffers
- Utilization becomes excessive
- Growth opportunities are missed
Hire too early
- Utilization falls
- Payroll grows faster than revenue
- Margins compress
Capacity chain
- Demand / backlog
- Capacity requirement
- Hiring need
- Revenue capacity
- Margin
Potential planning inputs
- Backlog
- Pipeline
- Utilization
- Hiring lead time
- Ramp time
- Turnover
- Role mix
- Compensation
Headcount planning should connect commercial demand with financial capacity.
Productivity
Understand the Productivity of the Workforce
Revenue per employee provides useful directional insight when it is read alongside the drivers behind it.
Read it alongside
- Utilization
- Pricing
- Staffing mix
- Gross margin
- Service model
Potential questions
- Is revenue growing faster than headcount?
- Is operating leverage improving?
- Are new hires creating sufficient capacity?
- Which service lines generate the strongest productivity?
Revenue per employee should not be used in isolation. Different functions, service lines, and delivery models require different staffing structures, so the measure is most useful compared against itself over time.
Staffing mix
The Right Work Should Be Done at the Right Level
Delivery margin is heavily influenced by who performs the work.
Delivery levels
- Partners
- Executives
- Managers
- Senior professionals
- Analysts
- Junior staff
- Contractors
Potential analysis
- Labor cost
- Bill rate
- Utilization
- Delivery responsibilities
- Supervision
- Margin
A strong delivery model balances expertise, client value, development opportunities, and margin.
Pricing models
Different Pricing Models Create Different Financial Risks
Time & materials
Economics depend on:
- Billable hours
- Rates
- Utilization
- Realization
Fixed fee
Economics depend on:
- Scope
- Staffing
- Hours required
- Change management
- Delivery efficiency
Recurring retainer
Economics depend on:
- Service intensity
- Capacity
- Renewal
- Client utilization of the service
The right profitability model should reflect how the business actually earns revenue.
Pipeline & capacity
Connect the Sales Pipeline to Delivery Capacity
Pipeline to staffing chain
- Pipeline
- Probability
- Expected start date
- Revenue
- Required delivery capacity
- Hiring / staffing
Potential questions
- If the pipeline converts, do we have enough people?
- If it does not convert, are we overstaffed?
- Which skills are required?
- When should recruiting begin?
Sales planning and workforce planning should not happen independently.
Compensation modeling
Align Compensation With Sustainable Business Economics
Our role is financial modeling and affordability analysis—not HR, legal, or compensation-law advice.
Potential support
- Merit planning
- Bonus pools
- Sales incentives
- Variable compensation
- Leadership and partner incentive structures
- Hiring economics
Incentives should consider
- Revenue
- Margin
- Utilization
- Collections
- Client retention
- Strategic priorities
Cash & working capital
Revenue on the Income Statement Is Not Cash in the Bank
Common sources of cash pressure
- Delayed billing
- Unbilled work
- DSO
- Project milestones
- Retainers
- Customer concentration
- Payroll timing
- Bonuses
- Growth hiring
Potential analysis
- Billing cycle
- Unbilled revenue
- Accounts receivable
- Collections forecast
- DSO
- Payroll
- Cash runway
In a labor-intensive business, payroll is predictable. Collections may not be.
Cash flow & working capital covers the 13-week forecast, billing discipline, and collections planning behind this work.
KPI framework
Focus Management on the Metrics That Drive Service Economics
Commercial
- Bookings
- Pipeline
- Backlog
- Win rate
- Average project size
Workforce
- Billable utilization
- Capacity
- Headcount
- Revenue per employee
Pricing
- Average bill rate
- Realization
- Discount rate
Profitability
- Project margin
- Client margin
- Contribution margin
- Service-line margin
Cash
- DSO
- Unbilled revenue
- Collections
- Operating cash flow
Planning
- Revenue forecast accuracy
- Utilization forecast accuracy
- Headcount forecast accuracy
The best KPI framework connects commercial activity, workforce productivity, profitability, and cash.
Business models
Professional Services FP&A Across Different Business Models
The FP&A discipline is consistent; the drivers that matter most differ by delivery model.
Consulting & advisory firms
- Utilization
- Project margin
- Client profitability
- Staffing mix
- Backlog
Engineering & architecture
- Project profitability
- Backlog
- Labor
- Utilization
- Project delivery timing
Staffing & recruiting
- Placements
- Bill/pay spreads
- Recruiter productivity
- Contractor headcount
- Customer concentration
- Working capital
IT & managed services
- Recurring contracts
- Utilization
- Labor mix
- Service margins
- Renewals
Certification, testing & inspection
- Billable days
- Auditor or specialist capacity
- Pricing
- Utilization
- Scheduling
- Travel economics
- Service-line profitability
Marketing & creative agencies
- Retainer economics
- Project profitability
- Utilization
- Subcontractors
- Client profitability
Forecasting
Build a Forecast That Reflects People, Backlog, and Capacity
Forecast chain
- Backlog / pipeline
- Project timing
- Utilization
- Headcount
- Revenue
- Labor cost
- Margin
- Cash
A service-business forecast should reflect how people create revenue—not just apply percentage growth to last year.
When the model is driver-based, management can trace any change in profit back to a specific assumption: a delayed project start, a utilization shortfall, a new hire class, or a rate change. Financial forecasting and budgeting & planning describe how we build and maintain that model.
Scenario planning
Stress-Test the Economics Before Committing
Utilization falls 5 points
What happens to profit?
Rates increase 4%
What margin improvement results?
Hiring accelerates
What utilization is needed to support it?
Major client delays work
What happens to revenue and staffing?
Backlog expands
How much additional capacity is needed?
Subcontractor usage increases
How does delivery margin change?
Scenario planning helps management understand which assumptions create the greatest financial sensitivity.
Strategic decision support covers how these scenarios translate into specific management decisions.
Deliverables
Professional Services FP&A Deliverables
- Driver-based revenue forecast
- Backlog forecast
- Utilization dashboard
- Bill-rate analysis
- Realization analysis
- Project profitability
- Client profitability
- Service-line profitability
- Headcount plan
- Capacity model
- Revenue-per-employee analysis
- Staffing-mix analysis
- Pricing model
- Compensation model
- Pipeline-to-capacity model
- Cash-flow forecast
- DSO analysis
- KPI dashboard
- Scenario model
- Monthly operating review package
Engagement
Flexible FP&A Support for Professional Services Firms
Focused project
Best for:
- Project profitability
- Utilization
- Pricing
- Headcount
- Forecasting
- Compensation modeling
Fractional FP&A
Best for recurring:
- Forecasting
- Management reporting
- KPI analysis
- Profitability
- Business partnership
Interim FP&A leadership
Best for:
- Finance leadership vacancy
- Growth
- Acquisition
- Transformation
- PE transition
Fit
Built for Growing Professional Services Businesses
Typical fit
- $10M–$100M revenue
- Privately held or PE-backed
- Existing accounting team
- Limited dedicated FP&A resources
- People-intensive or project-based business model
- Growing backlog and headcount complexity
- Management seeking stronger margin and capacity visibility
Particularly strong fit
- Consulting
- Engineering
- Architecture
- Staffing
- IT services
- Managed services
- Certification & testing
- Agencies
- Other project-based service businesses
Greater Chicago & Midwest
Professional Services FP&A Support Across Greater Chicago and the Midwest
Northline FP&A supports privately held and PE-backed professional-services businesses in Chicago and the surrounding business communities.
- Chicago
- Naperville
- Oak Brook
- Downers Grove
- Lisle
- Schaumburg
- Northbrook
- Deerfield
Support extends more broadly across the Midwest through remote collaboration combined with on-site executive and planning sessions where that is useful—working alongside an existing CFO, Controller, accounting team, or owner rather than replacing them.
Why Northline FP&A
Finance Support Built Around Service-Business Economics
FP&A Focus
Concentrate on forecasting, profitability, planning, and decision support rather than outsourced accounting.
Business-Driver Orientation
Connect utilization, rates, backlog, headcount, and project economics to financial outcomes.
Senior-Level Finance Support
Work directly with CEOs, CFOs, Controllers, and business leaders.
Hands-On Execution
Build and operate forecasts, dashboards, models, and management reporting.
Scalable Support
Engage through focused projects, fractional FP&A, or interim leadership as needs change.
Fractional FP&A
Ongoing FP&A capacity for recurring forecasting, reporting, and analysis.
Learn moreInterim FP&A Leadership
Senior coverage during vacancies, rapid growth, or transitions.
Learn moreFinancial Forecasting
Driver-based forecasts built on backlog, utilization, and capacity.
Learn moreCash Flow & Working Capital
Billing, collections, DSO, and liquidity planning.
Learn moreProfitability Analysis
Project, client, and service-line economics including cost-to-serve.
Learn moreBudgeting & Planning
An annual plan built on realistic utilization, pricing, and hiring assumptions.
Learn moreStrategic Decision Support
Pricing, hiring, outsourcing, and expansion analysis.
Learn moreFP&A Maturity Assessment
A 10-dimension diagnostic of your finance function.
Learn moreFAQ
Professional Services FP&A Questions
- What does FP&A do in a professional services company?
- It connects backlog, utilization, pricing, headcount, project economics, and cash into a single forward-looking plan. The objective is to translate how people and projects create revenue into forecasts, analysis, and decisions management can act on.
- What is billable utilization?
- Billable utilization is the portion of available professional capacity spent on revenue-generating work. Definitions vary—available hours, target hours, or scheduled hours—so the measure should be defined once around your operating model and applied consistently.
- What is realization?
- Realization compares the revenue actually earned to the potential billable value of the work performed. Discounts, write-offs, scope creep, and fixed-fee overruns all reduce it, which is why realized economics matter more than published rates.
- How do you measure project profitability?
- The analysis can include contract value, earned and billed revenue, labor hours and cost, subcontractors, travel and other direct costs, change orders, and the estimated cost to complete—so margin is visible while the project is still in progress.
- Can you help with headcount planning?
- Yes. Headcount plans connect backlog, pipeline, utilization targets, hiring lead time, ramp, turnover, and compensation to revenue capacity and margin.
- Can you help analyze client profitability?
- Yes. Client-level analysis considers pricing, service intensity, seniority mix, travel, write-offs, and account-management effort alongside strategic value.
- Can you help with utilization and capacity planning?
- Yes. Utilization and capacity models show how much work the current team can deliver, where capacity is constrained, and what financial outcome different utilization levels produce.
- Can professional-services FP&A be fractional?
- Yes. Many growing firms need recurring FP&A capability—forecasting, profitability analysis, and management reporting—well before they need a full internal FP&A department.
- Do you replace our Controller?
- No. The service is designed to complement accounting and finance leadership. We work alongside your Controller, CFO, or accounting team and focus on forward-looking planning and analysis.
Diagnostic
How Mature Is Your Professional Services FP&A Capability?
Evaluate your company's capabilities across ten dimensions of the finance function.
- Financial reporting
- Budgeting
- Forecasting
- Cash flow
- Revenue planning
- Profitability
- KPIs
- Scenario analysis
- Systems
- Finance partnership
Next step
Turn People, Projects, and Backlog Into Better Financial Decisions.
Build stronger visibility into utilization, pricing, project profitability, headcount, revenue capacity, cash, and future performance so management can pursue profitable growth with greater confidence.
Serving professional-services businesses throughout Greater Chicago and the Midwest.