Greater Chicago & the Midwest
FP&A for Specialty Trade Contractors
Connect backlog, labor, project performance, service revenue, and cash to better financial decisions.
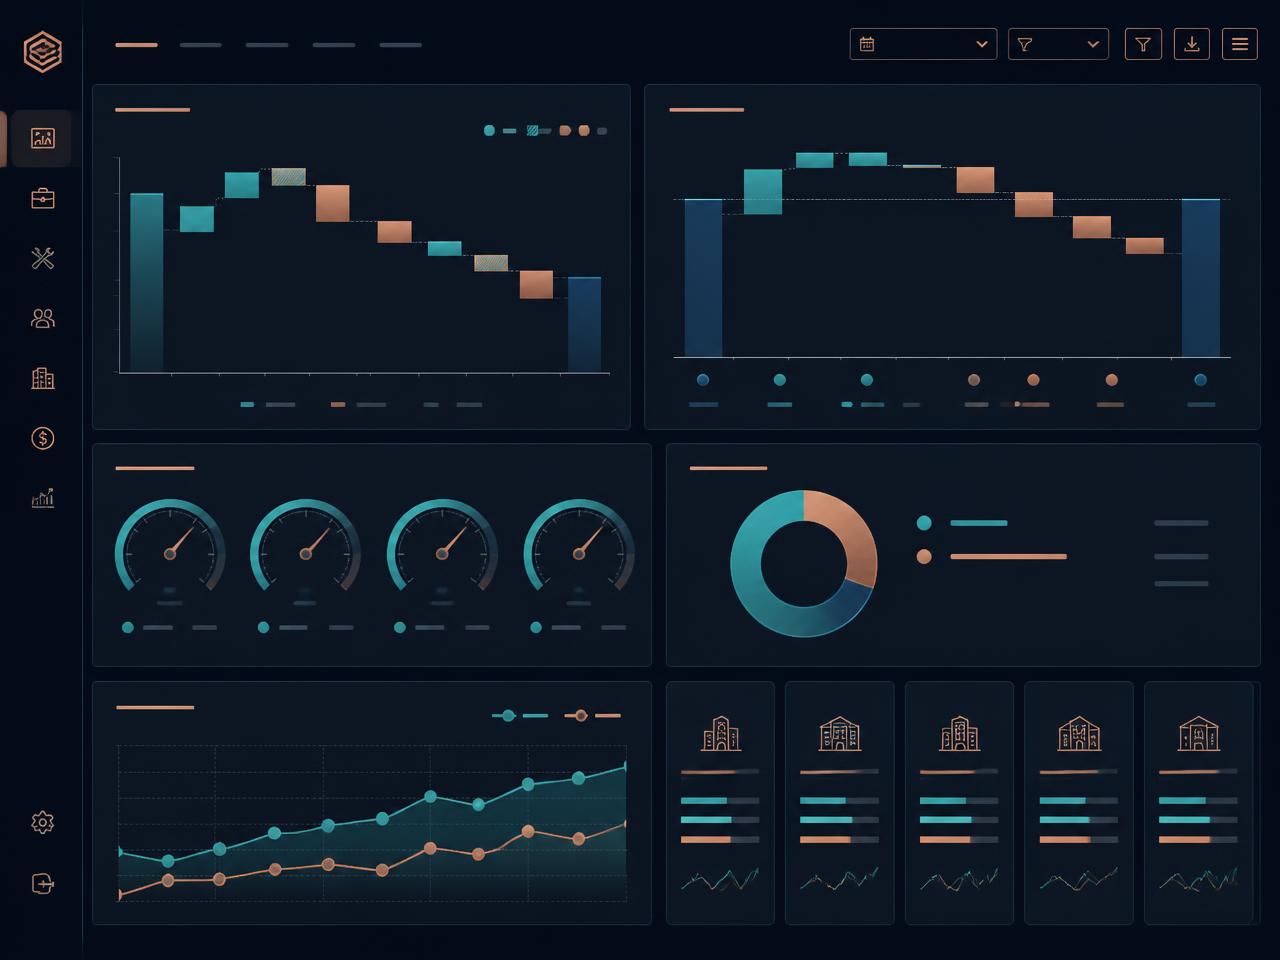
Northline FP&A helps privately held and PE-backed specialty trade contractors throughout Greater Chicago and the Midwest improve forecasting, project profitability, workforce planning, cash visibility, and strategic decision support.
Built for HVAC, electrical, plumbing, mechanical, roofing, fire protection, controls, service, and other skilled-trade businesses.
- Backlog conversion forecasting
- Project & service margin visibility
- Technician utilization economics
- 13-week cash and working capital
Designed for growing contractors generally between $10M and $100M in annual revenue.
The challenge
Strong Revenue Does Not Automatically Mean Strong Contractor Economics
Specialty trades businesses typically operate across several revenue streams at once, and each behaves differently on the income statement and in the bank account.
Revenue streams
- Installation projects
- Replacement work
- Service calls
- Maintenance agreements
- Emergency work
- Retrofit work
- Subcontracted projects
Each can differ in
- Margins
- Labor requirements
- Cash timing
- Risk profiles
- Working-capital needs
A contractor can grow revenue while margin, cash flow, and field productivity move in the wrong direction.
Strong FP&A helps management connect operational activity—backlog, crews, service calls, materials, and billing—with the financial outcomes those activities produce, so mix and execution changes are visible early rather than at year end.
Five specialty trades questions
Can Your Finance Function Answer These Questions Quickly?
What is our true backlog, and when will it convert into revenue and cash?
Which projects, service lines, and customers generate the strongest margins?
Are labor productivity and overtime improving or eroding profitability?
How much cash will growth require over the next 13 weeks and 12 months?
When should we add technicians, equipment, vehicles, or a new branch?
Specialty trades FP&A should connect field operations, commercial activity, and financial performance.
Warning signs
Signs Your Specialty Trades FP&A Capability Needs Improvement
- Backlog is reported but not converted into a reliable revenue forecast.
- Project margin issues are discovered late.
- Labor overruns are difficult to quantify financially.
- Service and installation profitability are not separated.
- Maintenance agreements are not analyzed for lifetime economics.
- Hiring decisions are made without clear workload or capacity analysis.
- Overtime increases without a clear margin explanation.
- Material cost increases are not recovered through pricing.
- Cash balances vary significantly despite profitable operations.
- Accounts receivable and retainage create recurring cash pressure.
- Branch or location profitability is unclear.
- Equipment and vehicle purchases are approved without financial analysis.
- Finance reporting is highly manual.
- Revenue growth outpaces cash generation.
If several of these conditions exist, the business may have an FP&A visibility gap rather than an accounting problem.
Core capabilities
Financial Planning Built Around How Contractors Actually Operate
Backlog & Revenue Planning
- Project backlog
- Service pipeline
- Contract timing
- Job starts
- Completion schedules
- Maintenance agreements
- Seasonal demand
Project & Service Profitability
- Estimated margin
- Actual margin
- Cost to complete
- Labor
- Materials
- Subcontractors
- Change orders
- Service-call economics
Labor & Capacity Planning
- Technician headcount
- Field labor
- Utilization
- Overtime
- Productivity
- Crew mix
- Hiring
- Staffing capacity
Cash & Working Capital
- 13-week cash flow
- Accounts receivable
- Retainage
- Collections
- Inventory
- Vendor payments
- Debt service
Forecasting & Planning
- Rolling forecast
- Annual budget
- Project forecasting
- Headcount
- CapEx
- Cash flow
- Scenarios
Strategic Decision Support
- Pricing
- Branch expansion
- Vehicle purchases
- Equipment
- Acquisitions
- Service-line growth
- Maintenance-agreement strategy
Backlog
Backlog Is Valuable Only If You Understand When It Converts
Backlog should be analyzed at a level of detail that supports forecasting, not simply reported as a total dollar figure.
Analyze backlog by
- Project
- Customer
- Expected start date
- Expected completion date
- Expected revenue
- Expected margin
- Labor requirements
- Material requirements
The forecast equation
Backlog + start dates + labor capacity = revenue forecast
Backlog roll-forward
- Beginning backlog
- + New awards
- – Revenue recognized / work completed
- = Ending backlog
A large backlog creates confidence only when management understands the timing, margin, and capacity required to execute it.
Project profitability
Know Whether Jobs Are Making Money Before They Are Finished
Project profitability should be updated throughout execution so expected final margin—not just historical margin—is visible to management.
Potential components
- Contract value
- Original estimate
- Change orders
- Labor hours
- Labor cost
- Materials
- Subcontractors
- Equipment
- Expected cost to complete
- Expected final margin
Project margin bridge
- Original expected margin
- Labor variance
- Material variance
- Change orders
- Schedule impact
- Subcontractor impact
- Updated expected margin
The best time to identify a project-margin issue is while management can still influence the outcome.
Profitability analysis describes how job, service-line, and customer economics are built and maintained.
Revenue mix
Service and Project Revenue Behave Differently
The same contractor can run three distinct financial models at once. Each deserves its own margin and capacity view.
Installation / Project Work
Often driven by:
- Backlog
- Bid margin
- Labor execution
- Materials
- Change orders
- Project duration
Service & Repair
Often driven by:
- Technician utilization
- Average ticket
- Labor productivity
- Dispatch efficiency
- Parts
- Pricing
Maintenance Agreements
Often driven by:
- Contract value
- Renewal
- Service frequency
- Labor requirements
- Upsell opportunities
- Customer lifetime value
The right FP&A model should separately evaluate revenue streams with different economics.
Recurring revenue
Recurring Service Revenue Can Improve Visibility and Enterprise Value
What agreements can create
- Recurring revenue
- Stronger customer retention
- Predictable workload
- Recurring service opportunities
- Replacement opportunities
Potential analysis
- Agreement count
- Annual recurring revenue
- Renewal rate
- Service cost
- Gross margin
- Technician hours
- Customer lifetime economics
- Conversion to repair or replacement work
Recurring revenue matters most when management understands renewal, service cost, and lifetime profitability.
Labor productivity
Translate Field Productivity Into Financial Impact
Field metrics become management tools once finance can express them in margin and cash terms.
Operational inputs
- Labor hours
- Billable hours
- Estimated hours
- Overtime
- Job duration
- Crew size
- Technician utilization
Financial outcomes
- Revenue
- Gross margin
- Contribution margin
- EBITDA
Management questions
- What is the financial impact of 5% lower field productivity?
- How much margin is lost through overtime?
- Which crews or project types consistently outperform estimates?
- When does another technician become financially justified?
Field productivity becomes more actionable when management can quantify the financial impact.
Capacity
Know When the Business Needs More Field Capacity
Trade contractors constantly balance demand against the crews available to serve it.
The balance
- Customer demand
- Technician availability
- Overtime
- Response times
- Service quality
- Hiring lead time
- Labor cost
Capacity chain
- Demand
- Available technician hours
- Utilization
- Revenue capacity
- Hiring requirement
Hiring should be connected to expected demand, productivity, and margin—not only current workload pressure.
Pricing
Understand Whether Pricing Is Keeping Pace With Cost
Cost pressures
- Skilled labor
- Overtime
- Equipment
- Vehicles
- Materials
- Fuel
- Subcontractors
- Insurance
Potential analysis
- Rate increases
- Labor-rate economics
- Minimum service charges
- Project markups
- Service-call pricing
- Customer-specific profitability
Pricing analysis should measure realized margin recovery—not simply published price increases.
See profitability analysis for how realized margin is tracked by service line, project type, and customer.
Change orders
Protect Margin When Project Scope Changes
Scope changes are a normal part of trade work. The financial question is whether they are priced, approved, and collected in time.
What they affect
- Revenue
- Labor
- Materials
- Scheduling
- Subcontractors
- Cash timing
Potential analysis
- Submitted vs. approved changes
- Margin by change order
- Unapproved scope
- Time impact
- Expected collection timing
Unpriced or delayed change orders can turn operating complexity into margin and cash-flow risk.
The work is financial analysis of change-order economics—not contract administration, claims advisory, or legal review.
Cash & working capital
Profitable Contractors Can Still Experience Cash Pressure
Potential cash drivers
- Payroll timing
- Materials purchased before billing
- Progress billing
- Retainage
- Customer payment delays
- Seasonal demand
- Equipment purchases
- Debt service
- Inventory
Cash conversion chain
- Work performed
- Invoice / progress billing
- Receivable
- Retainage / collection timing
- Cash
The time between performing the work and collecting the cash must be funded.
Cash flow & working capital covers the underlying planning approach in more detail.
13-week cash
Build a Weekly View of Liquidity
A contractor 13-week cash forecast pairs collections with the payroll, material, and subcontractor commitments that come due first.
Cash inflows
- Service collections
- Project payments
- Deposits
- Progress billings
- Other receipts
Cash outflows
- Payroll
- Materials
- Subcontractors
- Vehicles
- Equipment
- Taxes
- Insurance
- Debt service
Weekly cash visibility gives management time to adjust collections, spending, project timing, or financing before liquidity becomes urgent.
Branch economics
Know Which Locations Are Creating Value
As contractors add locations, consolidated results can hide very different local economics.
Analyze by location
- Revenue
- Service mix
- Labor
- Gross margin
- Overhead
- Vehicle costs
- Local management
- Working capital
- EBITDA
Management questions
- Is a branch large enough to support its overhead?
- Which locations have the strongest service penetration?
- Are local staffing levels appropriate?
- Where should the company invest next?
Growth by location should be evaluated through both revenue opportunity and local economics.
Fleet & CapEx
Make Equipment and Fleet Decisions With a Clear View of Return and Cash
Potential investments
- Service vans
- Trucks
- Specialty equipment
- Tools
- Warehouse
- Dispatch technology
- Building controls equipment
- Shop facilities
Typical analysis
- Purchase cost
- Financing
- Operating cost
- Labor savings
- Capacity impact
- Revenue impact
- Payback
- Cash flow
The right investment decision balances operating need, financial return, and liquidity capacity.
Strategic decision support covers how these investment cases are structured and reviewed.
Seasonality
Plan for Seasonal Demand Before It Arrives
For HVAC, roofing, and other weather-sensitive trades, seasonality shapes revenue, labor, inventory, and cash at the same time.
- Peak service periods
- Shoulder seasons
- Hiring
- Overtime
- Inventory
- Marketing
- Cash
- Maintenance-agreement scheduling
Seasonality should be reflected in revenue, labor, working capital, and cash forecasts—not treated as a surprise each year.
Acquisitions
Evaluate Acquisitions Through the Economics of the Operating Model
Specialty trades markets remain fragmented, and add-on acquisitions are a common growth path for both privately held and PE-backed contractors.
Potential analysis
- Purchase price
- Revenue
- EBITDA
- Recurring service revenue
- Customer concentration
- Labor
- Fleet
- Working capital
- Debt service
- Synergies
- Integration costs
- Cash flow
Acquisition modeling should show not only what the target earns today, but how the transaction affects the combined company's cash flow and financial capacity.
Northline FP&A can support financial modeling and scenario analysis but does not replace legal, tax, valuation, or transaction diligence specialists.
KPI framework
Connect Field KPIs to Financial Results
Commercial
- Bookings
- Backlog
- Average ticket
- Service calls
- Maintenance agreements
- Renewal rate
Labor
- Technician utilization
- Revenue per technician
- Overtime
- Labor efficiency
- Estimated vs. actual hours
Project Performance
- Gross margin
- Job margin
- Cost-to-complete variance
- Change orders
- Project duration
Service Performance
- Service gross margin
- Average ticket
- Agreement revenue
- Agreement renewal
Cash
- DSO
- Retainage
- Collections
- Working capital
- Cash conversion
Planning
- Revenue forecast accuracy
- Backlog conversion
- Labor forecast accuracy
- Cash forecast accuracy
The best KPI framework connects field operations directly to margin and cash.
Forecasting
Build a Forecast That Reflects Backlog, Labor, Service, and Seasonality
Forecast chain
- Backlog / service demand
- Project timing
- Technician / crew capacity
- Revenue
- Labor & materials
- Margin
- Working capital
- Cash
A contractor forecast should reflect the work the business expects to perform—not simply apply a growth rate to last year.
When the model is driver-based, management can trace a change in profit back to a specific assumption: a delayed job start, a productivity shortfall, an overtime spike, or a material cost increase. Financial forecasting and budgeting & planning describe how we build and maintain that model.
Scenario planning
Stress-Test the Business Before Conditions Change
Labor costs rise 5%
What happens to project and service margins?
Backlog conversion slows
What happens to revenue and cash?
Add 10 technicians
What demand is required to support the hires?
Materials increase 8%
What pricing recovery is required?
Major customer pays 30 days late
What happens to liquidity?
New branch opens
What revenue is needed to reach break-even?
Scenario planning helps management understand which assumptions create the greatest financial sensitivity.
Deliverables
Specialty Trades FP&A Deliverables
- Backlog forecast
- Revenue forecast
- Project profitability model
- Cost-to-complete analysis
- Service-line profitability
- Maintenance-agreement economics
- Technician utilization dashboard
- Labor productivity analysis
- Labor-capacity plan
- Price / margin analysis
- Material-cost analysis
- Change-order tracking analytics
- Branch profitability
- Fleet / CapEx model
- 13-week cash forecast
- Working-capital dashboard
- Collections forecast
- Scenario model
- KPI dashboard
- Monthly operating review package
Engagement
Flexible FP&A Support for Specialty Trade Contractors
Focused project
Best for:
- Project profitability
- Backlog forecasting
- Labor analysis
- Pricing
- Cash forecasting
- Branch analysis
- CapEx decisions
Fractional FP&A
Best for recurring:
- Forecasting
- Management reporting
- KPI analysis
- Profitability
- Cash planning
- Strategic decision support
Interim FP&A leadership
Best for:
- Finance leadership vacancy
- Rapid growth
- Acquisition
- Transformation
- PE transition
Fit
Built for Growing Specialty Trade Businesses
Typical fit
- $10M–$100M revenue
- Privately held or PE-backed
- Existing accounting team
- Limited dedicated FP&A resources
- Project, service, or recurring maintenance revenue
- Growing technician or field workforce
- Significant backlog or working-capital complexity
- Management seeking stronger margin and cash visibility
Particularly strong fit
- HVAC
- Electrical
- Plumbing
- Mechanical
- Roofing
- Fire protection
- Building controls
- Commercial service
- Energy-efficiency contracting
- Other skilled-trade businesses
Greater Chicago & Midwest
Specialty Trades FP&A Support Across Greater Chicago and the Midwest
Northline FP&A supports privately held and PE-backed trade contractors in Chicago and the surrounding business communities.
- Chicago
- Naperville
- Oak Brook
- Downers Grove
- Lisle
- Schaumburg
- Aurora
- Bolingbrook
- Elgin
- Northbrook
Support extends more broadly across the Midwest through remote collaboration combined with on-site executive and operational planning sessions where that is useful—working alongside an existing CFO, Controller, accounting team, or owner rather than replacing them.
Why Northline FP&A
Finance Support Built Around Contractor Economics
FP&A Focus
Concentrate on forecasting, profitability, cash flow, planning, and decision support rather than outsourced accounting.
Operational Driver Orientation
Connect backlog, labor, service activity, project execution, and working capital to financial outcomes.
Senior-Level Finance Support
Work directly with owners, CEOs, CFOs, Controllers, and operating leaders.
Hands-On Execution
Build and operate forecasts, dashboards, project models, and management reporting.
Scalable Support
Engage through focused projects, fractional FP&A, or interim leadership as needs change.
Fractional FP&A
Ongoing FP&A capacity for recurring forecasting, reporting, and analysis.
Learn moreInterim FP&A Leadership
Senior coverage during vacancies, rapid growth, or transitions.
Learn moreFinancial Forecasting
Driver-based forecasts built on backlog, labor capacity, and service demand.
Learn moreCash Flow & Working Capital
Billing, retainage, collections, and 13-week liquidity planning.
Learn moreProfitability Analysis
Project, service-line, customer, and branch economics.
Learn moreBudgeting & Planning
An annual plan built on realistic backlog, labor, and pricing assumptions.
Learn moreStrategic Decision Support
Pricing, hiring, equipment, branch, and acquisition analysis.
Learn moreContact
Schedule a Specialty Trades FP&A Review with Jeff Belden.
Learn moreFAQ
Specialty Trades FP&A Questions
- What does FP&A do for a specialty trade contractor?
- It connects backlog, labor, project execution, service revenue, cash, and capital decisions into one forward-looking plan. The objective is to translate field and commercial activity into forecasts, profitability analysis, and management insight that support pricing, hiring, equipment, and growth decisions.
- Can you help with project profitability?
- Yes. Project analysis can include contract value, original estimate, change orders, labor hours and cost, materials, subcontractors, equipment, and the estimated cost to complete—so expected final margin is visible while the job is still in progress.
- Can you help forecast backlog?
- Yes. Backlog analysis can incorporate expected start dates, project duration, labor capacity, expected revenue conversion, and expected margin, so backlog becomes a revenue and cash forecast rather than a single reported number.
- Can you help analyze technician productivity?
- Yes, from a financial and capacity-planning perspective. We quantify how estimated versus actual hours, overtime, utilization, and crew mix affect margin and revenue capacity. We do not provide field operations or dispatch management consulting.
- Can you help with service agreement economics?
- Yes. Analysis can include recurring revenue, renewal rates, labor requirements, service cost, gross margin, and customer lifetime economics, including conversion into repair or replacement work.
- Can you help with cash flow and retainage?
- Yes. We build 13-week cash forecasts and working-capital analysis covering progress billing, receivables, retainage, collections timing, inventory, vendor payments, and debt service.
- Can you help evaluate hiring or adding technicians?
- Yes. Capacity, productivity, expected demand, margin, and cash impact can all be modeled, so hiring is connected to workload and financial return rather than only to current workload pressure.
- Can you help evaluate a new branch?
- Yes. Branch analysis can cover revenue potential, service mix, labor, overhead, vehicle costs, working capital, break-even, and expected EBITDA contribution.
- Can you help with an acquisition?
- Yes, through financial modeling, cash-flow scenarios, and integration planning within scope. We do not replace legal, tax, valuation, or transaction diligence specialists.
- Can specialty trades FP&A be fractional?
- Yes. Many growing contractors need recurring FP&A capability—forecasting, profitability analysis, cash planning, and management reporting—well before they need a full internal FP&A department.
Diagnostic
How Mature Is Your Specialty Trades FP&A Capability?
Evaluate your company's capabilities across ten dimensions of the finance function.
- Financial reporting
- Budgeting
- Forecasting
- Cash flow
- Revenue planning
- Profitability
- KPIs
- Scenario analysis
- Systems
- Finance partnership
Next step
Turn Backlog, Labor, and Project Data Into Better Financial Decisions.
Build stronger visibility into project profitability, service economics, field productivity, cash flow, backlog, and future financial performance so management can pursue profitable growth with greater confidence.
Serving specialty trade contractors throughout Greater Chicago and the Midwest.