Greater Chicago & the Midwest
FP&A for Private Equity Portfolio Companies
Build the financial visibility, accountability, and decision support required to execute the value-creation plan.
Northline FP&A helps PE-backed businesses throughout Greater Chicago and the Midwest strengthen forecasting, management reporting, KPI visibility, profitability analysis, cash planning, and strategic financial decision support.
Designed for portfolio companies that need stronger finance capability without necessarily building a large internal FP&A team immediately.
- Rolling forecast & EBITDA bridge
- Board and sponsor reporting
- Value-creation tracking
- 13-week cash and working capital
Supporting lower-middle-market and middle-market businesses generally between $10M and $100M in annual revenue.
After the transaction
The Finance Requirements Often Change Immediately After a Transaction
A business may have operated successfully for years with capable accounting and owner-driven planning. New ownership usually raises expectations about how quickly and clearly performance can be explained.
What already works well
- Solid accounting
- Reliable monthly close
- Experienced Controller
- Owner-driven planning
What ownership now expects
- Forecasting
- Reporting cadence
- KPI visibility
- Cash management
- EBITDA performance
- Working capital
- Board reporting
- Accountability
- Scenario analysis
- Value-creation tracking
The reporting process that supported the business before the transaction may not be sufficient for the next stage of ownership.
Strong FP&A helps management move from historical reporting toward forward-looking management—explaining not only what happened, but what is expected next and which actions can change the outcome.
Five portfolio company questions
Can the Finance Function Answer These Questions Quickly?
Where will revenue, EBITDA, and cash finish the year based on current performance?
Which value-creation initiatives are ahead, behind, or at risk?
What is driving the change in EBITDA versus plan?
How much cash and working capital will growth require?
What actions should management consider to close performance gaps?
PE-backed FP&A should connect the investment thesis and operating plan to measurable financial outcomes.
Warning signs
Signs a Portfolio Company Needs Stronger FP&A Capability
- Forecasting is primarily an annual budgeting exercise.
- Board reporting requires significant manual preparation.
- Actual versus budget analysis stops at high-level variances.
- EBITDA bridges are inconsistent or difficult to produce.
- Revenue forecasts are not connected to commercial drivers.
- Cash and working-capital forecasts lack sufficient forward visibility.
- KPI definitions vary between management and the sponsor.
- Value-creation initiatives are not tied to financial results.
- Customer or product profitability is unclear.
- Acquisition integration reporting is fragmented.
- Management receives financial results but limited forward-looking analysis.
- CFO or Controller is overloaded with both accounting and FP&A.
- Finance reporting depends heavily on one individual.
- Strategic scenarios require significant manual modeling.
If several of these conditions exist, the portfolio company may need additional FP&A capability rather than simply more accounting resources.
Core capabilities
Institutional-Quality FP&A Without Unnecessary Overhead
Forecasting & Planning
- Rolling forecasts
- Annual budget
- Revenue drivers
- Headcount
- CapEx
- EBITDA
- Cash
Management & Board Reporting
- Monthly performance packages
- EBITDA bridges
- KPI dashboards
- Forecast updates
- Risk and opportunity summaries
Profitability & Value Creation
- Customer profitability
- Product and service profitability
- Pricing
- Margin improvement
- Operational initiatives
- Value-creation tracking
Cash & Working Capital
- 13-week cash flow
- Working capital
- DSO
- Inventory
- DPO
- Debt service
- Liquidity
M&A & Integration Support
- Acquisition modeling
- Add-on integration
- Synergy tracking
- Consolidated reporting
- Purchase-plan impacts
Strategic Decision Support
- Hiring
- Pricing
- Capital allocation
- Expansion
- Cost actions
- Investment scenarios
100-day plan & forecasting
Translate the 100-Day Plan Into a Rolling Forecast
The first months after a transaction establish the operating cadence for the ownership period. A rolling forecast keeps that cadence current and connected to cash.
Potential FP&A priorities
- Baseline the forecast
- Establish KPI definitions
- Build a management reporting package
- Create an EBITDA bridge
- Strengthen cash visibility
- Assess profitability
- Establish budget ownership
- Identify data gaps
- Prioritize financial-system improvements
Thesis to action
- Investment thesis
- 100-day priorities
- Operating drivers
- Financial KPIs
- Management actions
Forecast architecture
- Commercial drivers
- Revenue
- Gross margin
- Operating expenses
- EBITDA
- Working capital
- Cash
Views produced
- Base case
- Upside
- Downside
- Risks
- Opportunities
The forecast should help both management and the sponsor understand the current expected outcome and what could change it.
Explore Financial ForecastingA value-creation plan becomes more actionable when each initiative has clear financial measures, ownership, and timing.
EBITDA, KPI'S & VALUE CREATION
Explain EBITDA Performance and Track Value Creation
Management needs to separate what changed from why it changed, then connect strategic initiatives to the financial results they are meant to produce.
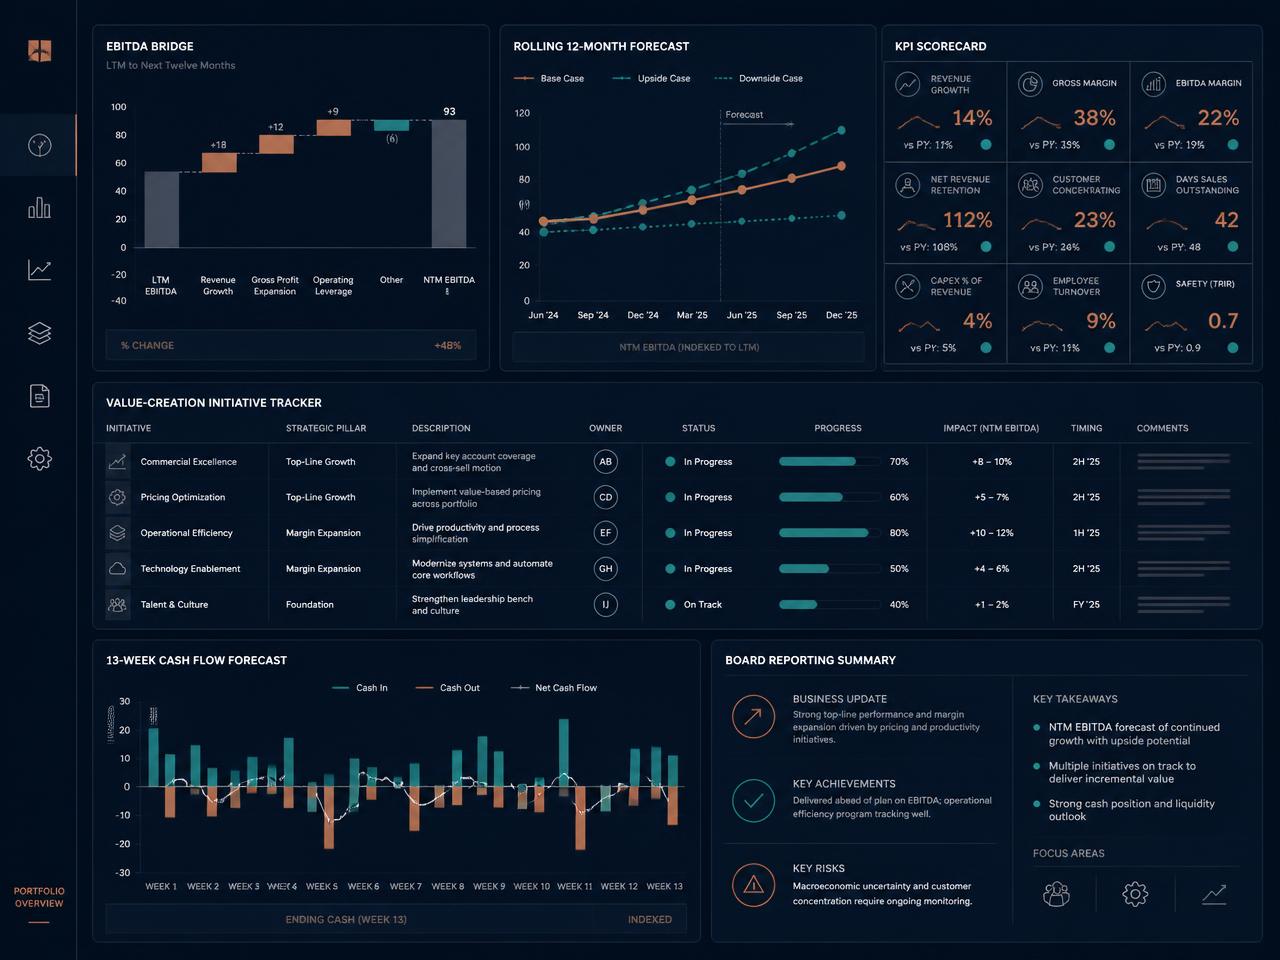
Illustrative EBITDA bridge
- Budget EBITDA
- Revenue / volume
- Price
- Mix
- Gross margin
- Labor
- Operating expenses
- Other drivers
- Current forecast EBITDA
What the bridge separates
- Commercial performance
- Pricing
- Operating execution
- Cost inflation
- Staffing
- Discretionary spending
The objective is not simply to report an EBITDA variance—it is to identify the drivers management can influence.
Growth
- Revenue
- Bookings
- Backlog
- Recurring revenue
- New customers
Margin
- Gross margin
- Contribution margin
- Price / volume / mix
- Labor productivity
Operations
- Utilization
- Throughput
- Service productivity
- Capacity
Cash
- DSO
- Inventory turns
- DPO
- Cash conversion
- Operating cash flow
Value creation
- Pricing initiatives
- Procurement savings
- Headcount productivity
- Cross-sell
- New locations
- Strategic initiatives
Typical initiatives
- Price increases
- Procurement savings
- Sales-force expansion
- Service growth
- Customer cross-sell
- Footprint optimization
- Automation
- SKU rationalization
- Headcount productivity
- Acquisition synergies
Tracking fields
- Annual target
- Current run rate
- Realized benefit
- Remaining opportunity
- Timing
- Risk
Tracker framework
- Initiative
- Owner
- Milestone
- Operational KPI
- Financial impact
- Status
Value creation should be measured through realized financial outcomes—not only project completion. A useful KPI framework should trace directly back to the value drivers that underwrite the investment.
Board reporting & finance capability
Build a Board Package That Explains the Business, Not Just the Financial Statements
A strong board package is the natural output of a finance function that has moved from historical reporting toward forward-looking decision support.
A strong board package may include
- Executive summary
- Actual vs. budget
- Actual vs. prior year
- Current forecast
- Revenue drivers
- EBITDA bridge
- KPI scorecard
- Cash flow
- Working capital
- Value-creation initiatives
- Risks and opportunities
- Key decisions
Three questions
- What changed?
- Why did it change?
- What is management doing about it?
Reporting should be concise enough for executives to absorb quickly while retaining enough analytical depth to support real decisions.
What we help establish
- Planning calendar
- Management reporting cadence
- Forecast process
- KPI ownership
- Model standards
- Reporting templates
- Accountability
- Finance-business partnership
Capability evolution
- Historical reporting
- Variance analysis
- Forecasting
- Scenario planning
- Decision support
The objective is to build a finance capability that becomes more strategic as the business grows.
Cash & working capital
Protect Liquidity While Executing the Growth Plan
PE-backed growth can consume significant cash long before it shows up in reported earnings.
Where the cash goes
- Working capital
- Inventory
- Hiring
- CapEx
- Integration costs
- Debt service
- Acquisition activity
Cash bridge
- EBITDA
- Working capital
- CapEx
- Taxes
- Debt service
- Free cash flow
EBITDA growth creates enterprise value, but cash conversion determines financial flexibility.
Profitability & commercial analytics
Find the Economics Beneath Revenue and Margin
Profitability analysis and commercial analytics help management distinguish revenue growth from value-creating growth and quantify the financial impact of pricing and mix decisions.
Analysis views
- Customer
- Product
- Service
- Channel
- Project
- Branch
- Business unit
Potential use cases
- Pricing opportunities
- Low-margin customers
- Product rationalization
- Service-line expansion
- Cost-to-serve
- Margin leakage
Potential areas
- Pricing realization
- Customer-specific pricing
- Discounting
- Customer retention
- Volume
- Mix
- Cross-sell
- Sales productivity
Revenue decomposition
- Revenue change
- Contribution margin
- EBITDA
Profitability analysis helps management distinguish revenue growth from value-creating growth. Commercial initiatives become more actionable when management can quantify their expected financial impact.
Explore Profitability AnalysisM&A, add-ons & integration
Support M&A, Add-Ons, and Ownership Transitions
From add-on integration to exit readiness, practical FP&A modeling helps management see the combined economics and make decisions before the integration is complete.
Typical FP&A needs after an add-on
- Consolidated forecast
- Reporting alignment
- KPI harmonization
- Synergy tracking
- Headcount
- Working capital
- Cash flow
- Systems transition
- Purchase-price assumptions
- Integration costs
Combined outlook
- Standalone company
- Add-on
- Synergies
- Less integration costs
- Combined financial outlook
Potential analysis
- Purchase price
- Leverage
- Debt service
- EBITDA
- Working capital
- Synergies
- Integration costs
- Cash flow
- Downside scenarios
Potential outputs
- Acquisition model
- Pro forma forecast
- Debt-service model
- Purchase-price sensitivity
- Synergy model
- Combined-company cash forecast
Exit readiness
- Historical KPI consistency
- Forecasting credibility
- Customer profitability
- Revenue segmentation
- EBITDA bridge
- Cash conversion
- Management reporting
- Operating trends
Better financial visibility helps management explain the business more clearly to future investors and buyers. Northline FP&A does not provide investment banking or transaction advisory services.
Northline FP&A supports management modeling and scenario analysis and does not replace legal, tax, quality-of-earnings, valuation, or formal transaction diligence.
How we engage
Flexible FP&A Support Across the Ownership Cycle
Northline FP&A can strengthen the portfolio company's internal management capability without creating a parallel reporting structure for the sponsor.
Interim FP&A Leadership
- Immediate leadership
- Forecast ownership
- Board reporting
- Team management
- Integration support
- Transition documentation
A leadership transition should not interrupt the planning and reporting cadence the business needs to operate.
Explore Interim FP&A LeadershipFractional FP&A
- Forecasting
- Reporting
- Profitability analysis
- KPI management
- Cash planning
- Strategic modeling
Fractional FP&A can provide institutional-quality capability while keeping the finance organization appropriately sized for the business.
Explore Fractional FP&ASponsor & Operating Partner Support
- New investment
- Weak forecasting
- Limited KPI visibility
- Board-reporting gaps
- CFO overloaded
- Temporary leadership vacancy
Where a sponsor identifies a finance capability gap, we add capacity quickly and work directly with company management.
Deliverables & fit
What We Deliver and Who We Work Best With
Northline FP&A produces the reports, models, and analysis that turn financial data into management decisions.
- Rolling forecast
- Annual operating plan
- 13-week cash forecast
- EBITDA bridge
- KPI dashboard
- Board reporting package
- Customer profitability
- Product / service profitability
- Price / volume / mix analysis
- Working-capital dashboard
- Value-creation tracker
- Headcount plan
- Scenario model
- Acquisition model
- Add-on integration forecast
- Synergy tracking
- Cash-flow model
- Debt-service forecast
- Executive operating review
- Forecast accuracy reporting
Typical fit
- $10M–$100M+ revenue
- Lower-middle-market or middle-market
- Existing accounting team
- CFO, Controller, or finance leader in place
- Limited dedicated FP&A capacity
- Sponsor-driven reporting requirements
- Active value-creation plan
- Meaningful growth, integration, or margin opportunities
Particularly strong fit
- Manufacturing
- Food / CPG
- Technology and subscription services
- Professional services
- Specialty trades
- Distribution
- Other operationally complex businesses
Post-Close / 100-Day Project
- Baseline forecast
- KPI design
- Board reporting
- FP&A process buildout
Focused Value-Creation Project
- Profitability
- Pricing
- Working capital
- Forecasting
- Scenario analysis
Fractional FP&A
- Forecasting
- Management reporting
- KPI analytics
- Cash planning
- Decision support
Interim FP&A Leadership
- Leadership vacancy
- Integration
- Transformation
- Rapid growth
Why Northline FP&A
Hands-On FP&A Built for the Pace of Private Equity Ownership
Northline FP&A supports PE-backed businesses and sponsors throughout Chicago and the surrounding business community, with broader Midwest support through remote collaboration and on-site sessions where appropriate.
Forward-Looking Finance
Focus on forecasting, performance management, and decision support rather than only historical reporting.
Operating Orientation
Connect financial performance to the operational drivers management can influence.
Sponsor-Ready Reporting
Create clear, decision-useful reporting without overcomplicating the organization.
Senior-Level Partnership
Work directly with CEOs, CFOs, Controllers, operators, and sponsor teams.
Hands-On Execution
Build and operate models, forecasts, dashboards, board packages, and management reporting.
Flexible Capacity
Use project, fractional, or interim structures based on the portfolio company's needs.
Greater Chicago & the Midwest
- Chicago
- Oak Brook
- Naperville
- Downers Grove
- Lisle
- Schaumburg
- Northbrook
- Deerfield
Broader Midwest support is delivered through remote collaboration, on-site management sessions, and board or operating reviews where appropriate.
Related services
Explore the underlying capabilities
Fractional FP&A
Recurring senior FP&A capacity alongside the existing finance team.
ExploreInterim FP&A Leadership
Immediate coverage during CFO or FP&A leadership transitions.
ExploreFinancial Forecasting
Rolling, driver-based forecasts connecting revenue to EBITDA and cash.
ExploreCash Flow & Working Capital
13-week liquidity, working capital, and debt-service visibility.
ExploreProfitability Analysis
Customer, product, service, and business-unit economics.
ExploreBudgeting & Planning
An operating plan with clear ownership, drivers, and accountability.
ExploreStrategic Decision Support
Pricing, hiring, capital allocation, and expansion analysis.
ExploreContact
Schedule a Portfolio Company FP&A Review with Jeff Belden.
ExploreFAQ
Private Equity Portfolio Company FP&A Questions
What does FP&A do in a private equity portfolio company?
FP&A connects the investment plan and operating drivers to forecasting, KPIs, cash flow, profitability, and management decisions. It translates the value-creation plan into measurable financial outcomes and gives management and the board a current view of where performance is heading and why.
When should a portfolio company build dedicated FP&A?
It depends on scale and complexity. Many businesses need stronger FP&A capability—rolling forecasts, board reporting, KPI definitions, and profitability analysis—well before they need a full internal FP&A department.
Can you work alongside an existing CFO or Controller?
Yes, and that is the most common structure. Northline FP&A complements the existing finance organization by adding planning, forecasting, analytical, and decision-support capacity. We do not replace the CFO, Controller, or accounting team.
Can you help build board reporting?
Yes. We build board and management packages covering the executive summary, actual versus budget and prior year, current forecast, EBITDA bridge, KPI scorecard, cash and working capital, value-creation initiatives, and key decisions.
Can you help track value-creation initiatives?
Yes. Operational initiatives can be linked to financial targets, owners, milestones, operational KPIs, and realized financial impact, so progress is measured through financial results rather than project completion alone.
Can you support a newly acquired portfolio company?
Yes. Typical early priorities include baselining the forecast, building management reporting, improving cash visibility, defining KPIs, assessing profitability, and supporting the 100-day plan.
Can you help with add-on acquisitions?
Yes, through financial modeling, consolidated forecasting, KPI alignment, synergy tracking, and integration planning within scope.
Can you provide interim FP&A leadership?
Yes. Interim FP&A leadership can cover a CFO or Head of FP&A vacancy, maintain the forecast and board reporting cadence, support integration, and document the process for the permanent hire.
Can you provide fractional FP&A to a PE-backed business?
Yes. Fractional FP&A provides recurring forecasting, reporting, profitability analysis, KPI management, cash planning, and strategic modeling while keeping the finance organization appropriately sized.
Do you provide quality of earnings or transaction diligence?
No. Northline FP&A focuses on FP&A, management modeling, forecasting, integration planning, and financial decision support. Formal quality-of-earnings, legal, tax, valuation, and transaction diligence should be performed by appropriately qualified specialists.
FP&A Maturity Assessment
How Mature Is the Portfolio Company's FP&A Capability?
The FP&A Maturity Assessment evaluates capability across ten dimensions of planning, reporting, and decision support.
Use the results to identify the capabilities that should be prioritized during the next stage of growth.
- Financial reporting
- Budgeting
- Forecasting
- Cash flow
- Revenue planning
- Profitability
- KPIs
- Scenario analysis
- Systems
- Finance partnership
Next step
Turn the Value-Creation Plan Into Financial Visibility and Accountability.
Build stronger forecasting, KPI reporting, profitability insight, cash visibility, and strategic decision support so management and sponsors have a clearer view of performance and the actions that can influence it.
Supporting PE-backed businesses throughout Greater Chicago and the Midwest.